5

I was interested today to find statistics and trends that relate to the SO environment generally. As a more occasional, non-daily, non professional user of SO I found this hard to find.

Searching questions on SO meta [statistics] there are some specific issue stats questions. However this is not visualised broad trend data, or other stats that can be explored to get a sense of the SO ecosystem overall.

I can think of three broad areas of statistics:

  1. Statistics on SO participation and daily question actions.

  2. Statistics on the topic and content of SO questions

  3. Statistics on the SO user base

What is of significant interest, and what interpretation is made of stats and trends I would expect will vary across SO users. The value is in knowing where to go to explore, either for a specific question, or to understand better the general SO environment.

And so my question, where can I find access to these kinds of SO related stats to explore and understand better the trends and changing dynamics of the SO environment?
9
  • 1
  • @rene Turned your link into a question-answer. It was not obvious to my mind that such stats would be posted as a question in SO meta. In the past, a graphed set of stats was posted as outside of SO meta itself as an interest document. I looked around in Help, and other places. I would imagine it would be similar to others. excellent link, thank you. And from 2020, the link to stats over all SE groups.
    – Cam_Aust
    Commented Jun 5, 2021 at 9:28
  • 1
    As an alternative you get trend stuff by yourself: meta.stackoverflow.com/questions/tagged/data-explorer or hands-on: data.stackexchange.com/tutorial
    – rene
    Commented Jun 5, 2021 at 9:30
  • 1
    or the SEDE tag on MSE: meta.stackexchange.com/questions/tagged/data-explorer
    – rene
    Commented Jun 5, 2021 at 9:38
  • seeking to list the places to go in an answer. Finding these links was not self evident from my original perspective. Help valued. Add meta stack exchange data-explorer.
    – Cam_Aust
    Commented Jun 5, 2021 at 9:41
  • Do any of you know of a site with visual graphed trend data for SO or SE in general? Found one to add via google search. Foolish human should have done this in the first place. Added to the list.
    – Cam_Aust
    Commented Jun 5, 2021 at 9:42
  • Perhaps the question needs an edit to be more brief, eg Where to access SO stats, to improve the question answer usefulness. I will come back and see if any other links to resources are left in comments, add, and consider editing the question. Open to suggestions.
    – Cam_Aust
    Commented Jun 5, 2021 at 10:01
  • Following comments suggestions, following link, and more research, I have refined and simplified the question, and provided a more comprehensive answer. I included images in the answer so that others can quickly scan and identify which of the options they are looking for.
    – Cam_Aust
    Commented Jun 5, 2021 at 15:55
  • I am wondering if the flag discussion is the right flag now. Open to suggestions.
    – Cam_Aust
    Commented Jun 5, 2021 at 15:58

1 Answer 1

6

The below seems to cover the major options for exploring stats of the Stackoverflow(SO) environment and user base at time of this answer 2021.

1. Statistics on SO participation and daily question actions.

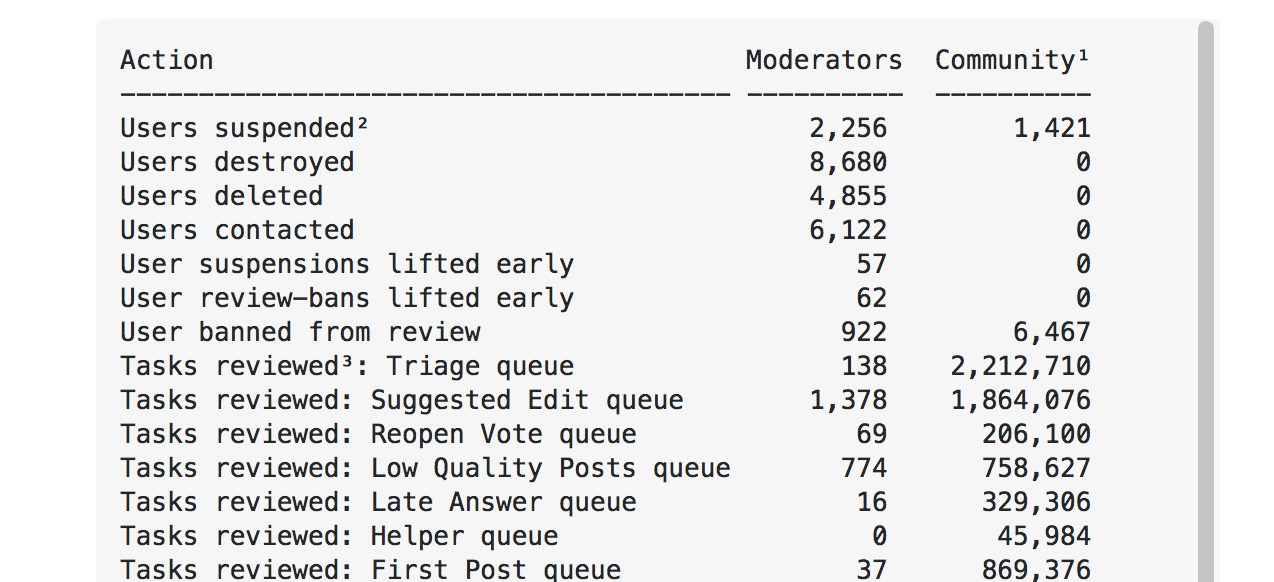
You can find useful statistics by searching stackoverflow meta using the tags [moderation] and [statistics]. Click this link: search tags moderation, statistics in Stackoverflow meta.

At time of this post it finds a list of stats for years 2016 to 2020. (Example 2016 below.)

(Example 2016)

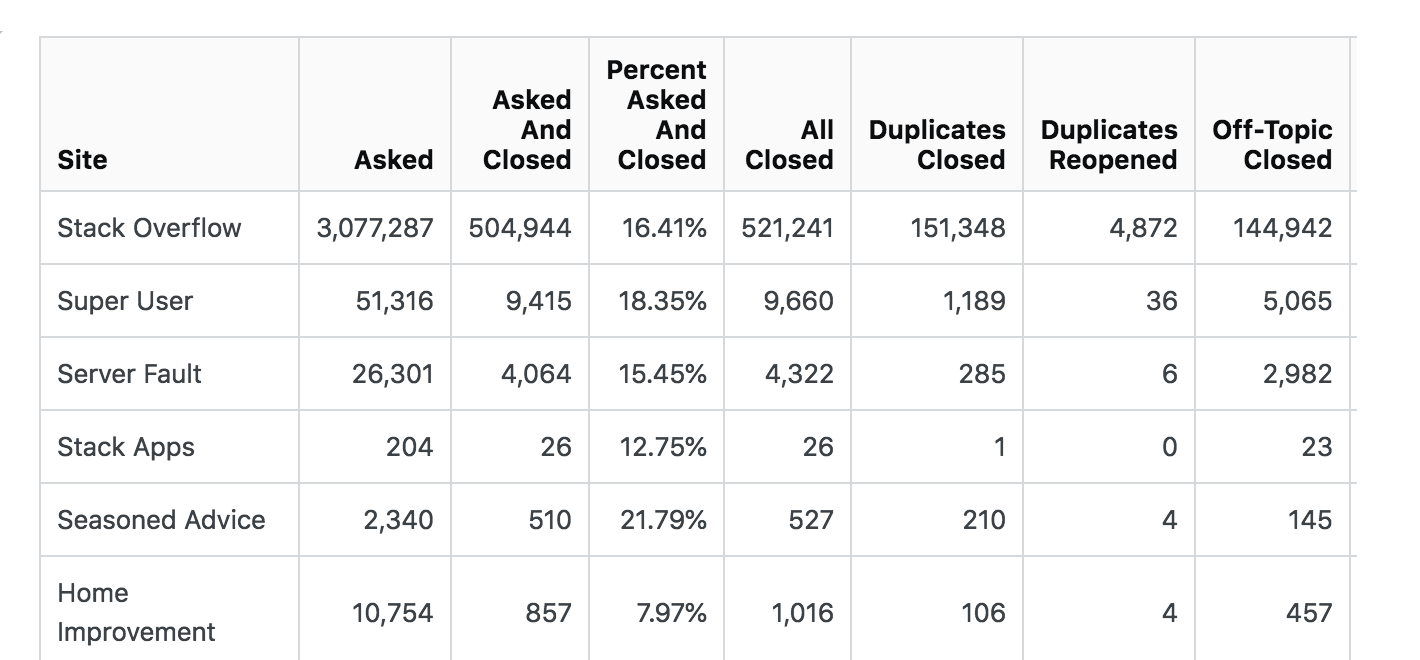
There are broader stats for comparison of SO to other StackExchange (SE) groups on StackExchange meta. Stats year 2020

SE Stats 2020

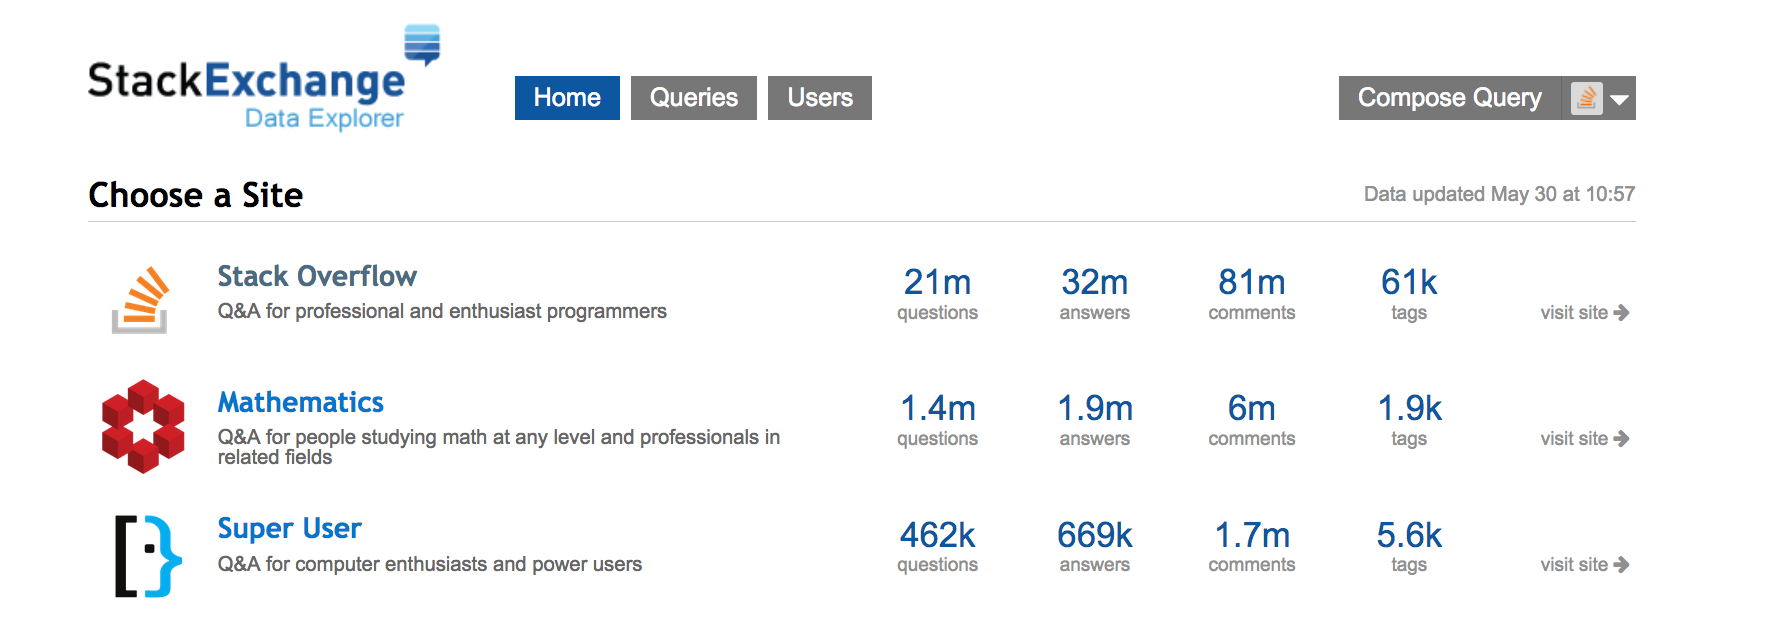
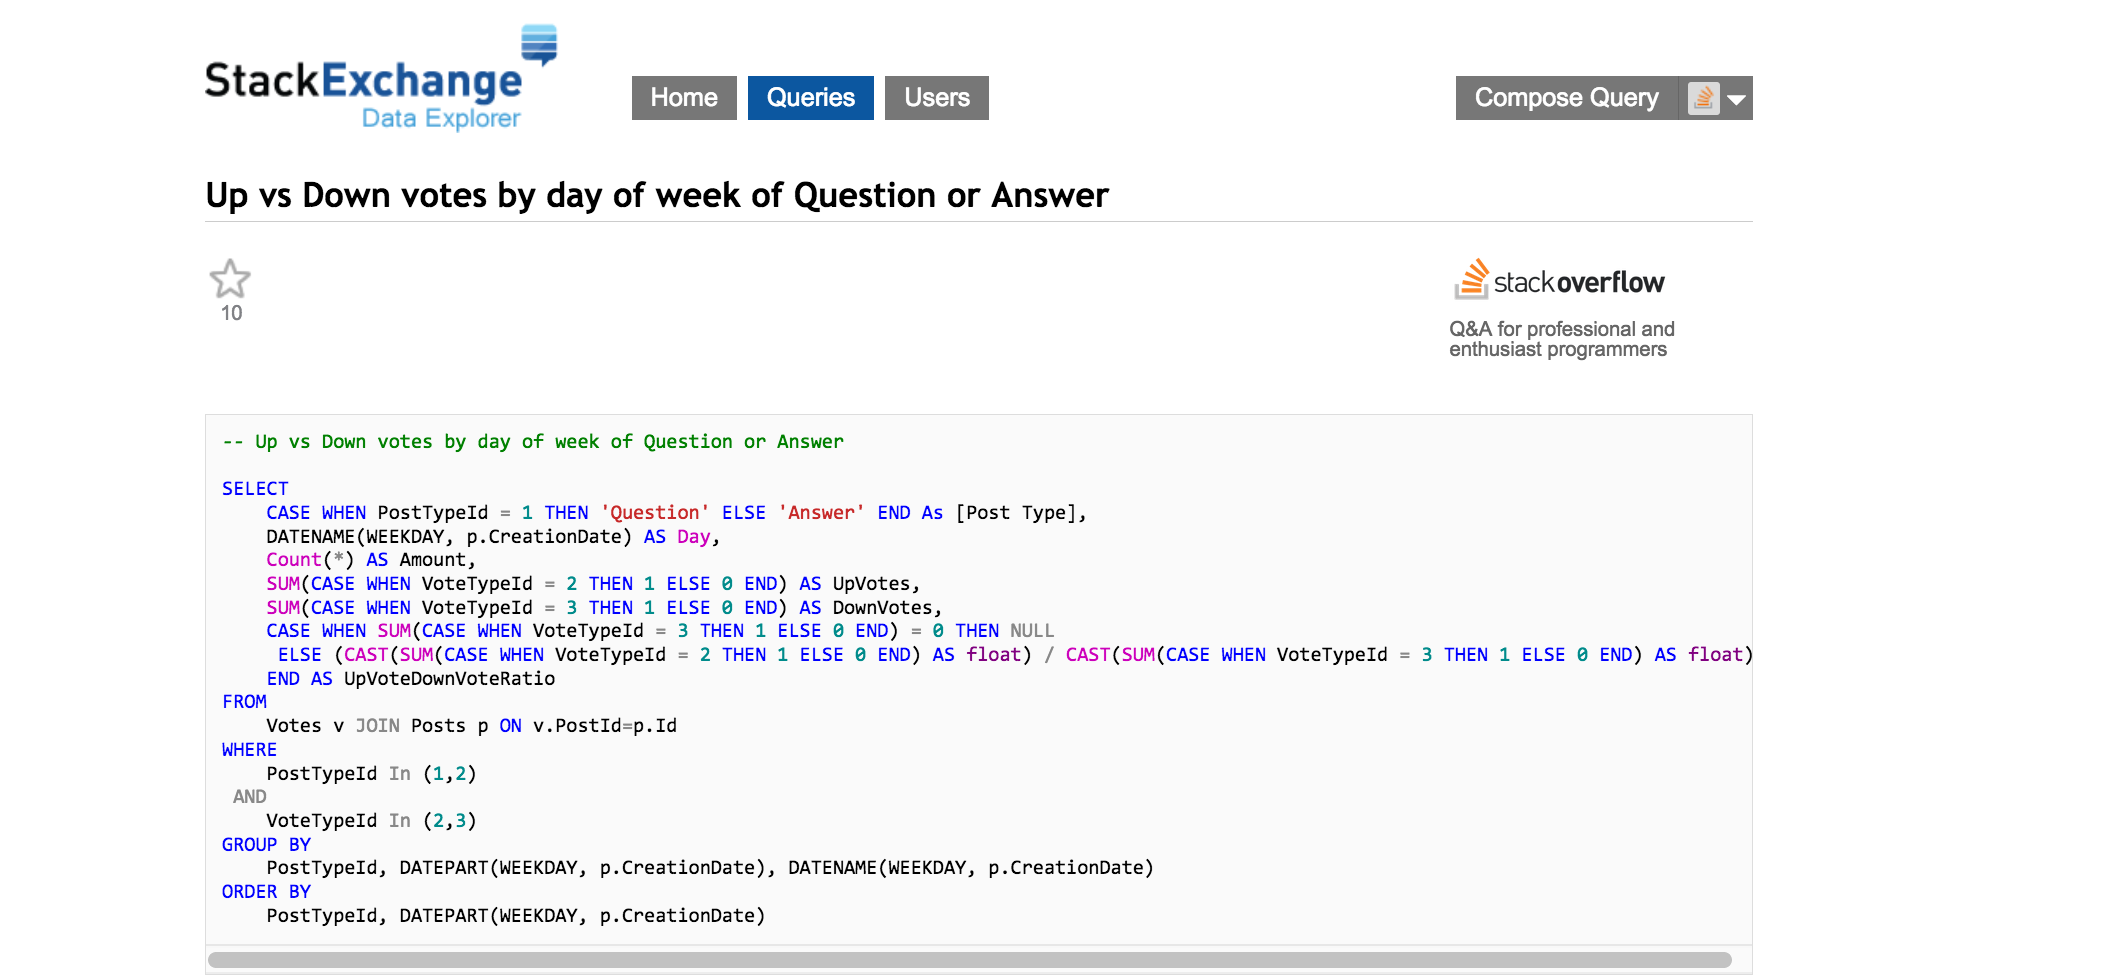
For more specific statistical questions, for example: "Up vs Down votes by day of week of Question or Answer"; there is StackExchange Data Explorer. On this site, with a little code, you can compose your own queries, or use queries formed by other SE users on SO and other SE groups.

SE Data Explorer

SE Data Explorer 2

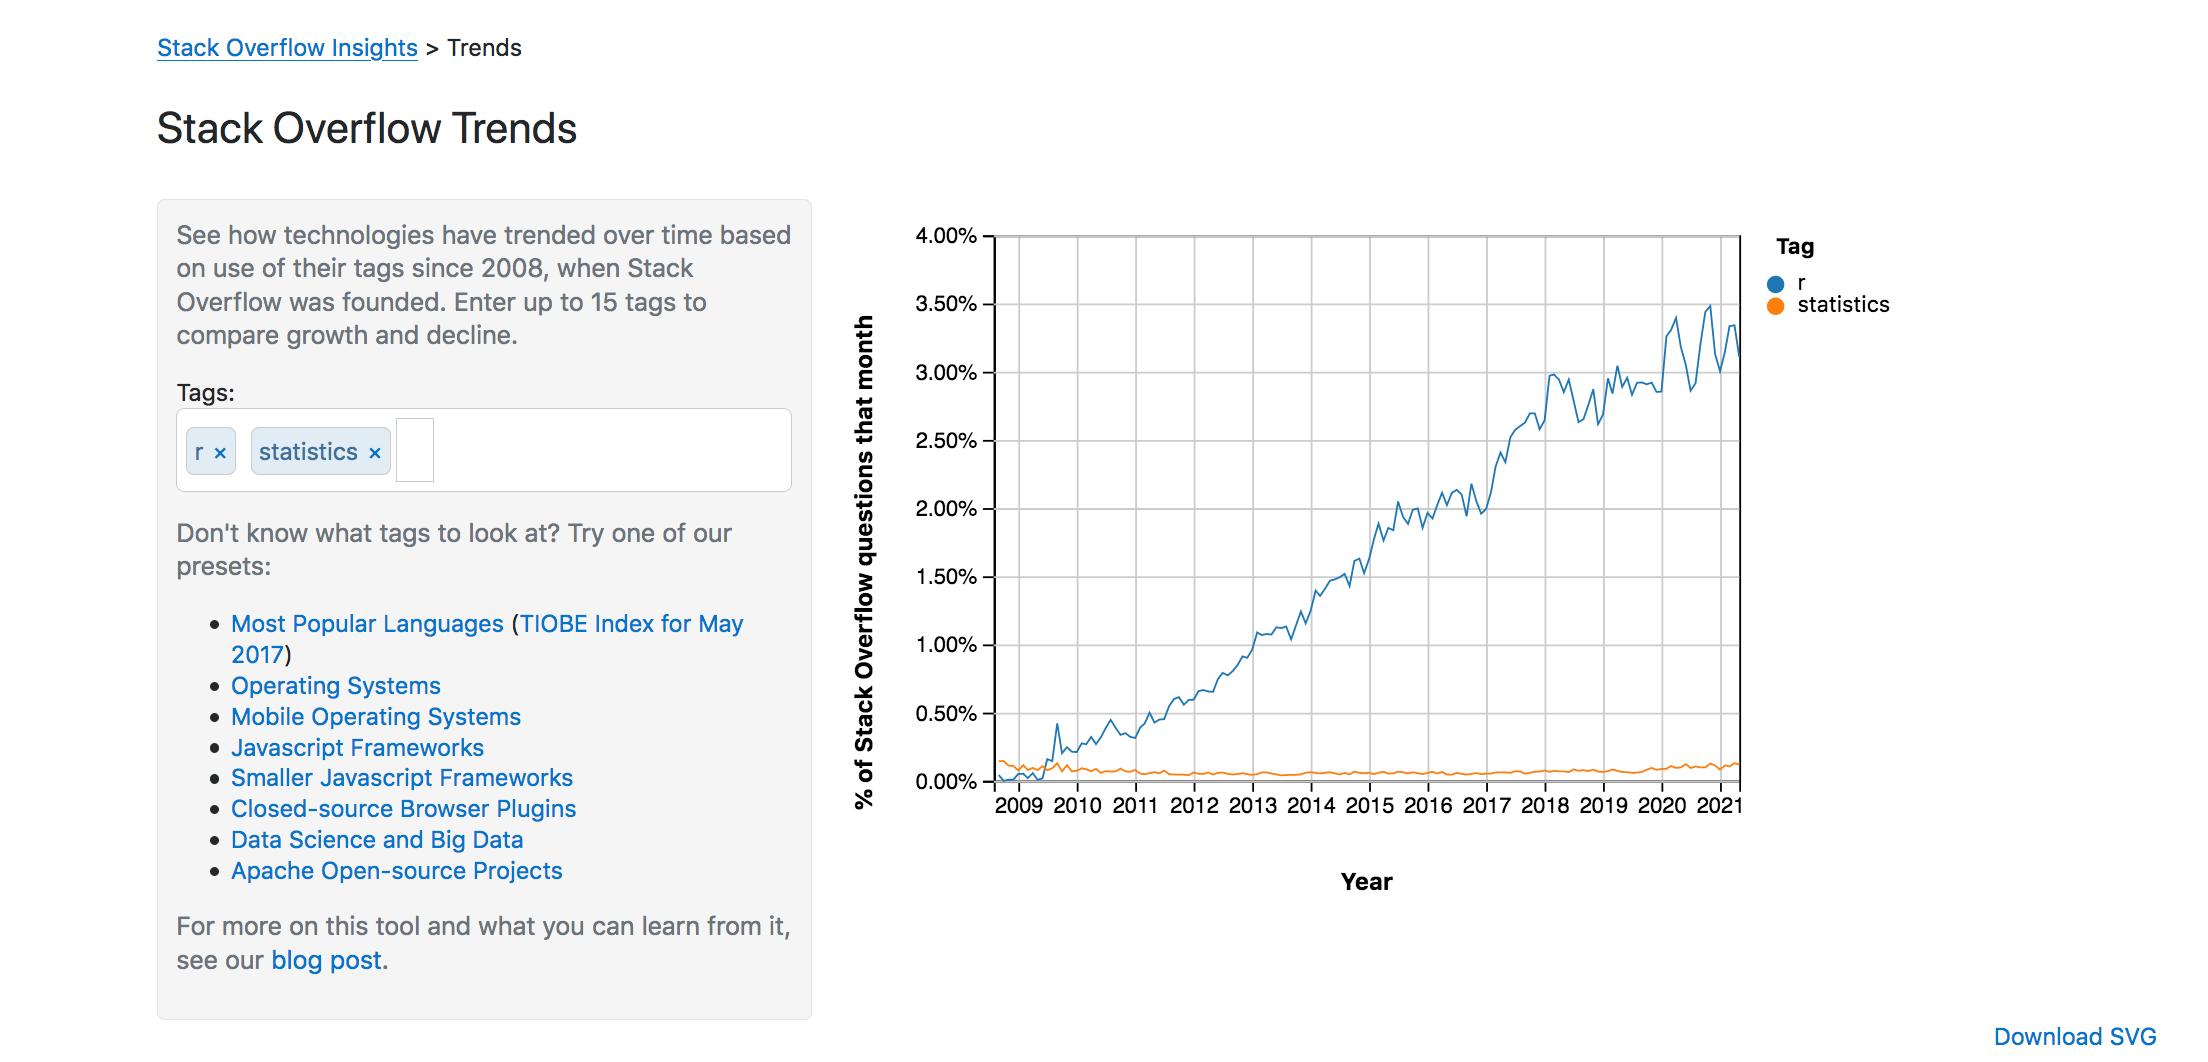
2. Statistics on the topic and content of SO questions.

For visualisation of trends in stackoverflow topics, the way to explore is at insights.stackoverflow.com/trends.

For a blog post about this: stackoverflow.blog/2017/05/09/introducing-stack-overflow-trends/

Stackoverflow insights

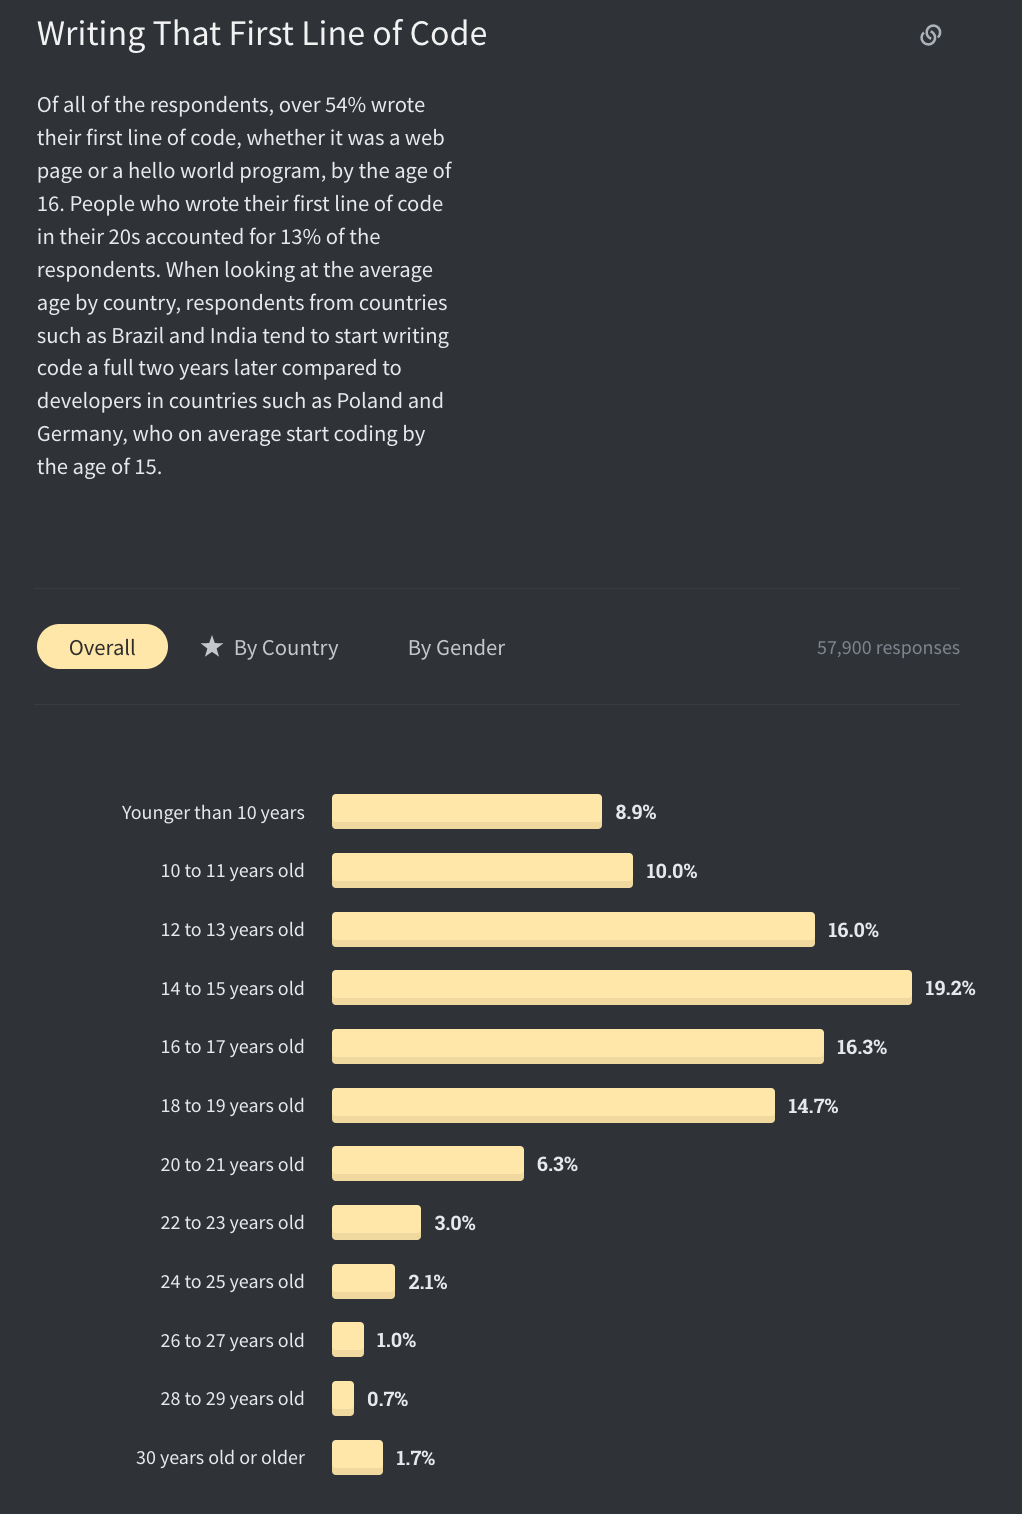
3. Statistics on the SO user base

For this, tap into the annual SO survey results. Stackoverflow 2020 Developer Survey

Or in future years, the main website: insights.stackoverflow.com/survey

Example of one question and results: Developer Survey 2020 example

You must log in to answer this question.

Not the answer you're looking for? Browse other questions tagged .