Last month we kicked off our monthly series of regular, bite-size, data-focused updates for Meta. Thanks to all who contributed to the discussion and suggested ideas for upcoming analyses.
One topic many people were particularly interested in hearing about is recent change to improve how welcoming Stack Overflow is; let's take this month to look at this issue a bit. Internal teams at Stack Overflow have been working on many projects related to how developers engage here but let's focus on two events:
- Jay's blog post at the end of April
- The new Code of Conduct, which launched in August
Notice that the blog post is a statement of values that did not involve any product changes, while the CoC launch (while also a statement of values) did involve product changes. When the CoC launched, we updated options for comment flagging, including adjusting flagging reasons and allowing all users to flag comments on their own post.
What kind of impact can we measure from either of these events? First off, let's walk through a (non-exhaustive) list of quantities that don't exhibit any change over the past year, through both of these events.
- The proportion of questions that are of good quality, and the proportion of questions by new users (
Rep < 111) that are of good quality - The proportion of questions that are closed
- The number of comments ever posted per question
- Voting patterns on questions (proportion of questions with positive or negative votes)
We do see changes in flagging patterns since August, but that is expected since more people can flag in more ways since the launch of CoC.
WOW, not so interesting, right?! This is all largely good news for us, though. These changes/events were not disruptive to how Stack Overflow functions overall.
Voting patterns on answers are slightly different. First, let's take a look at the trend for answers that have a positive score.
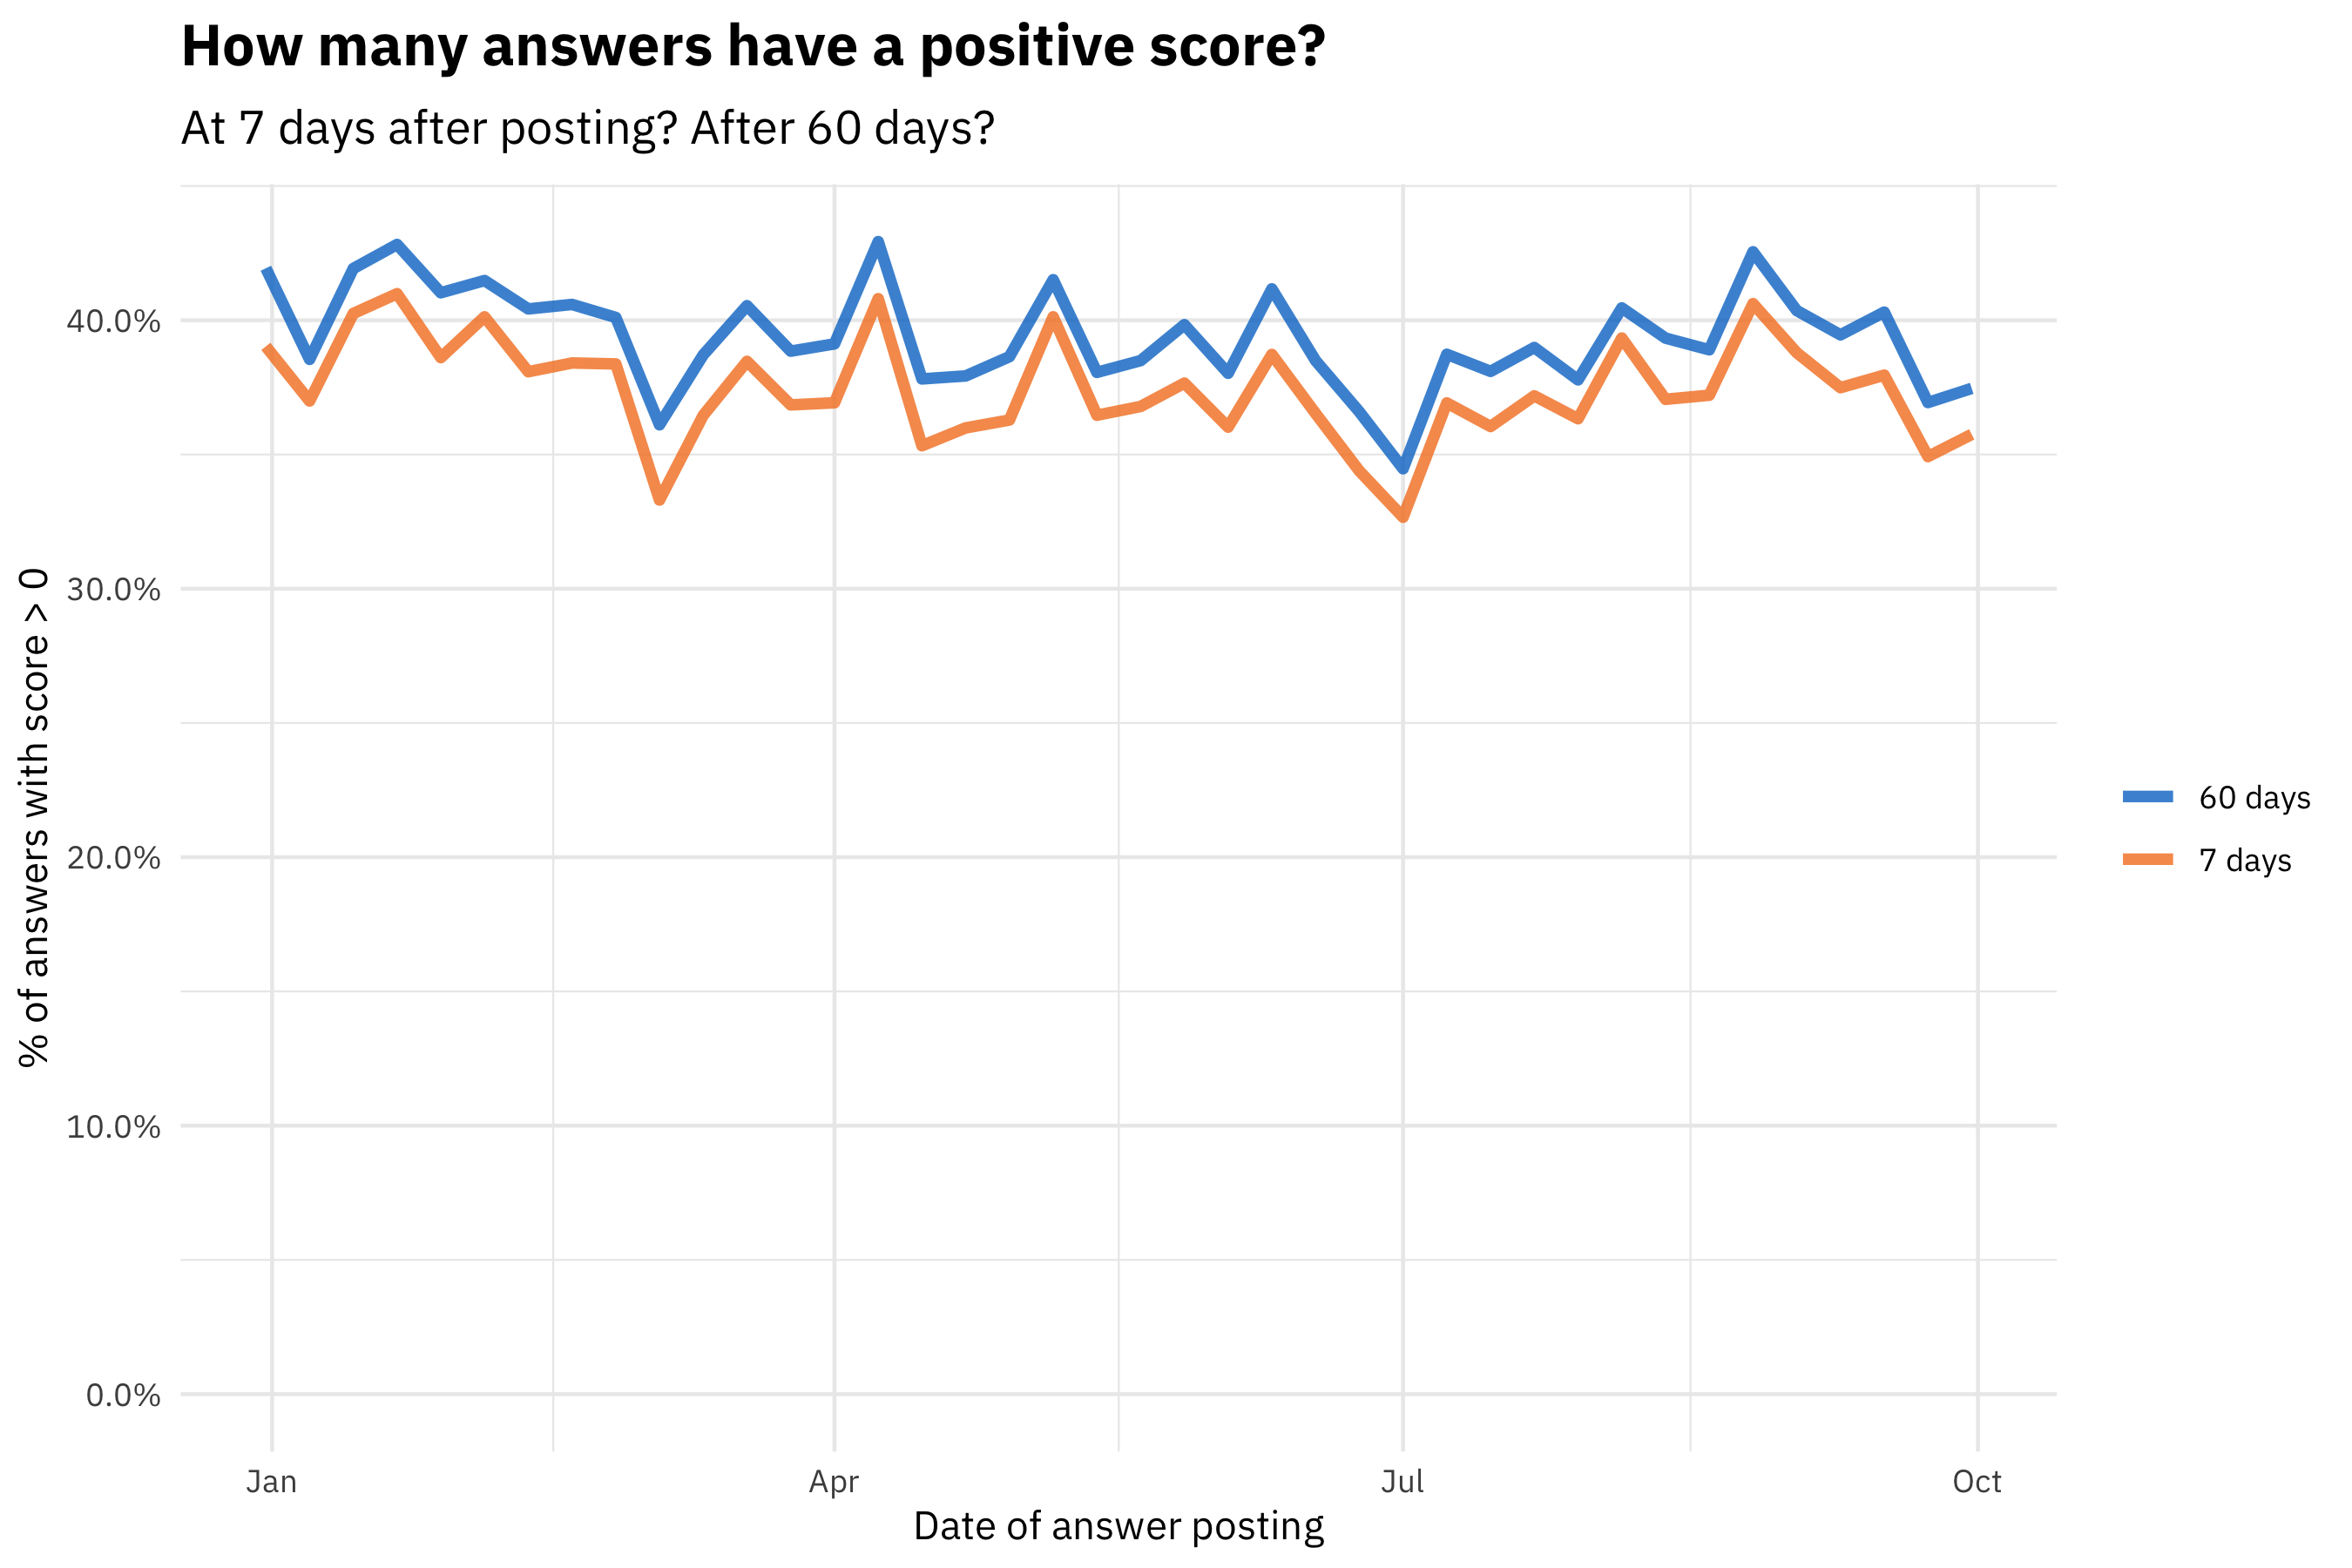
This plot shows, since the beginning of 2018, what proportion of answers have a positive score at 7 days after posting, and at 60 days after posting. The trend is overall mostly flat, indicating no significant change over the year (this is what the plots of the other quantities I mentioned above look like as well). See how the line for 60 days is shifted higher, indicating that more helpful answers are discovered by 60 days than are found by 7 days.
Next, let's take a look at answers that have a negative score.
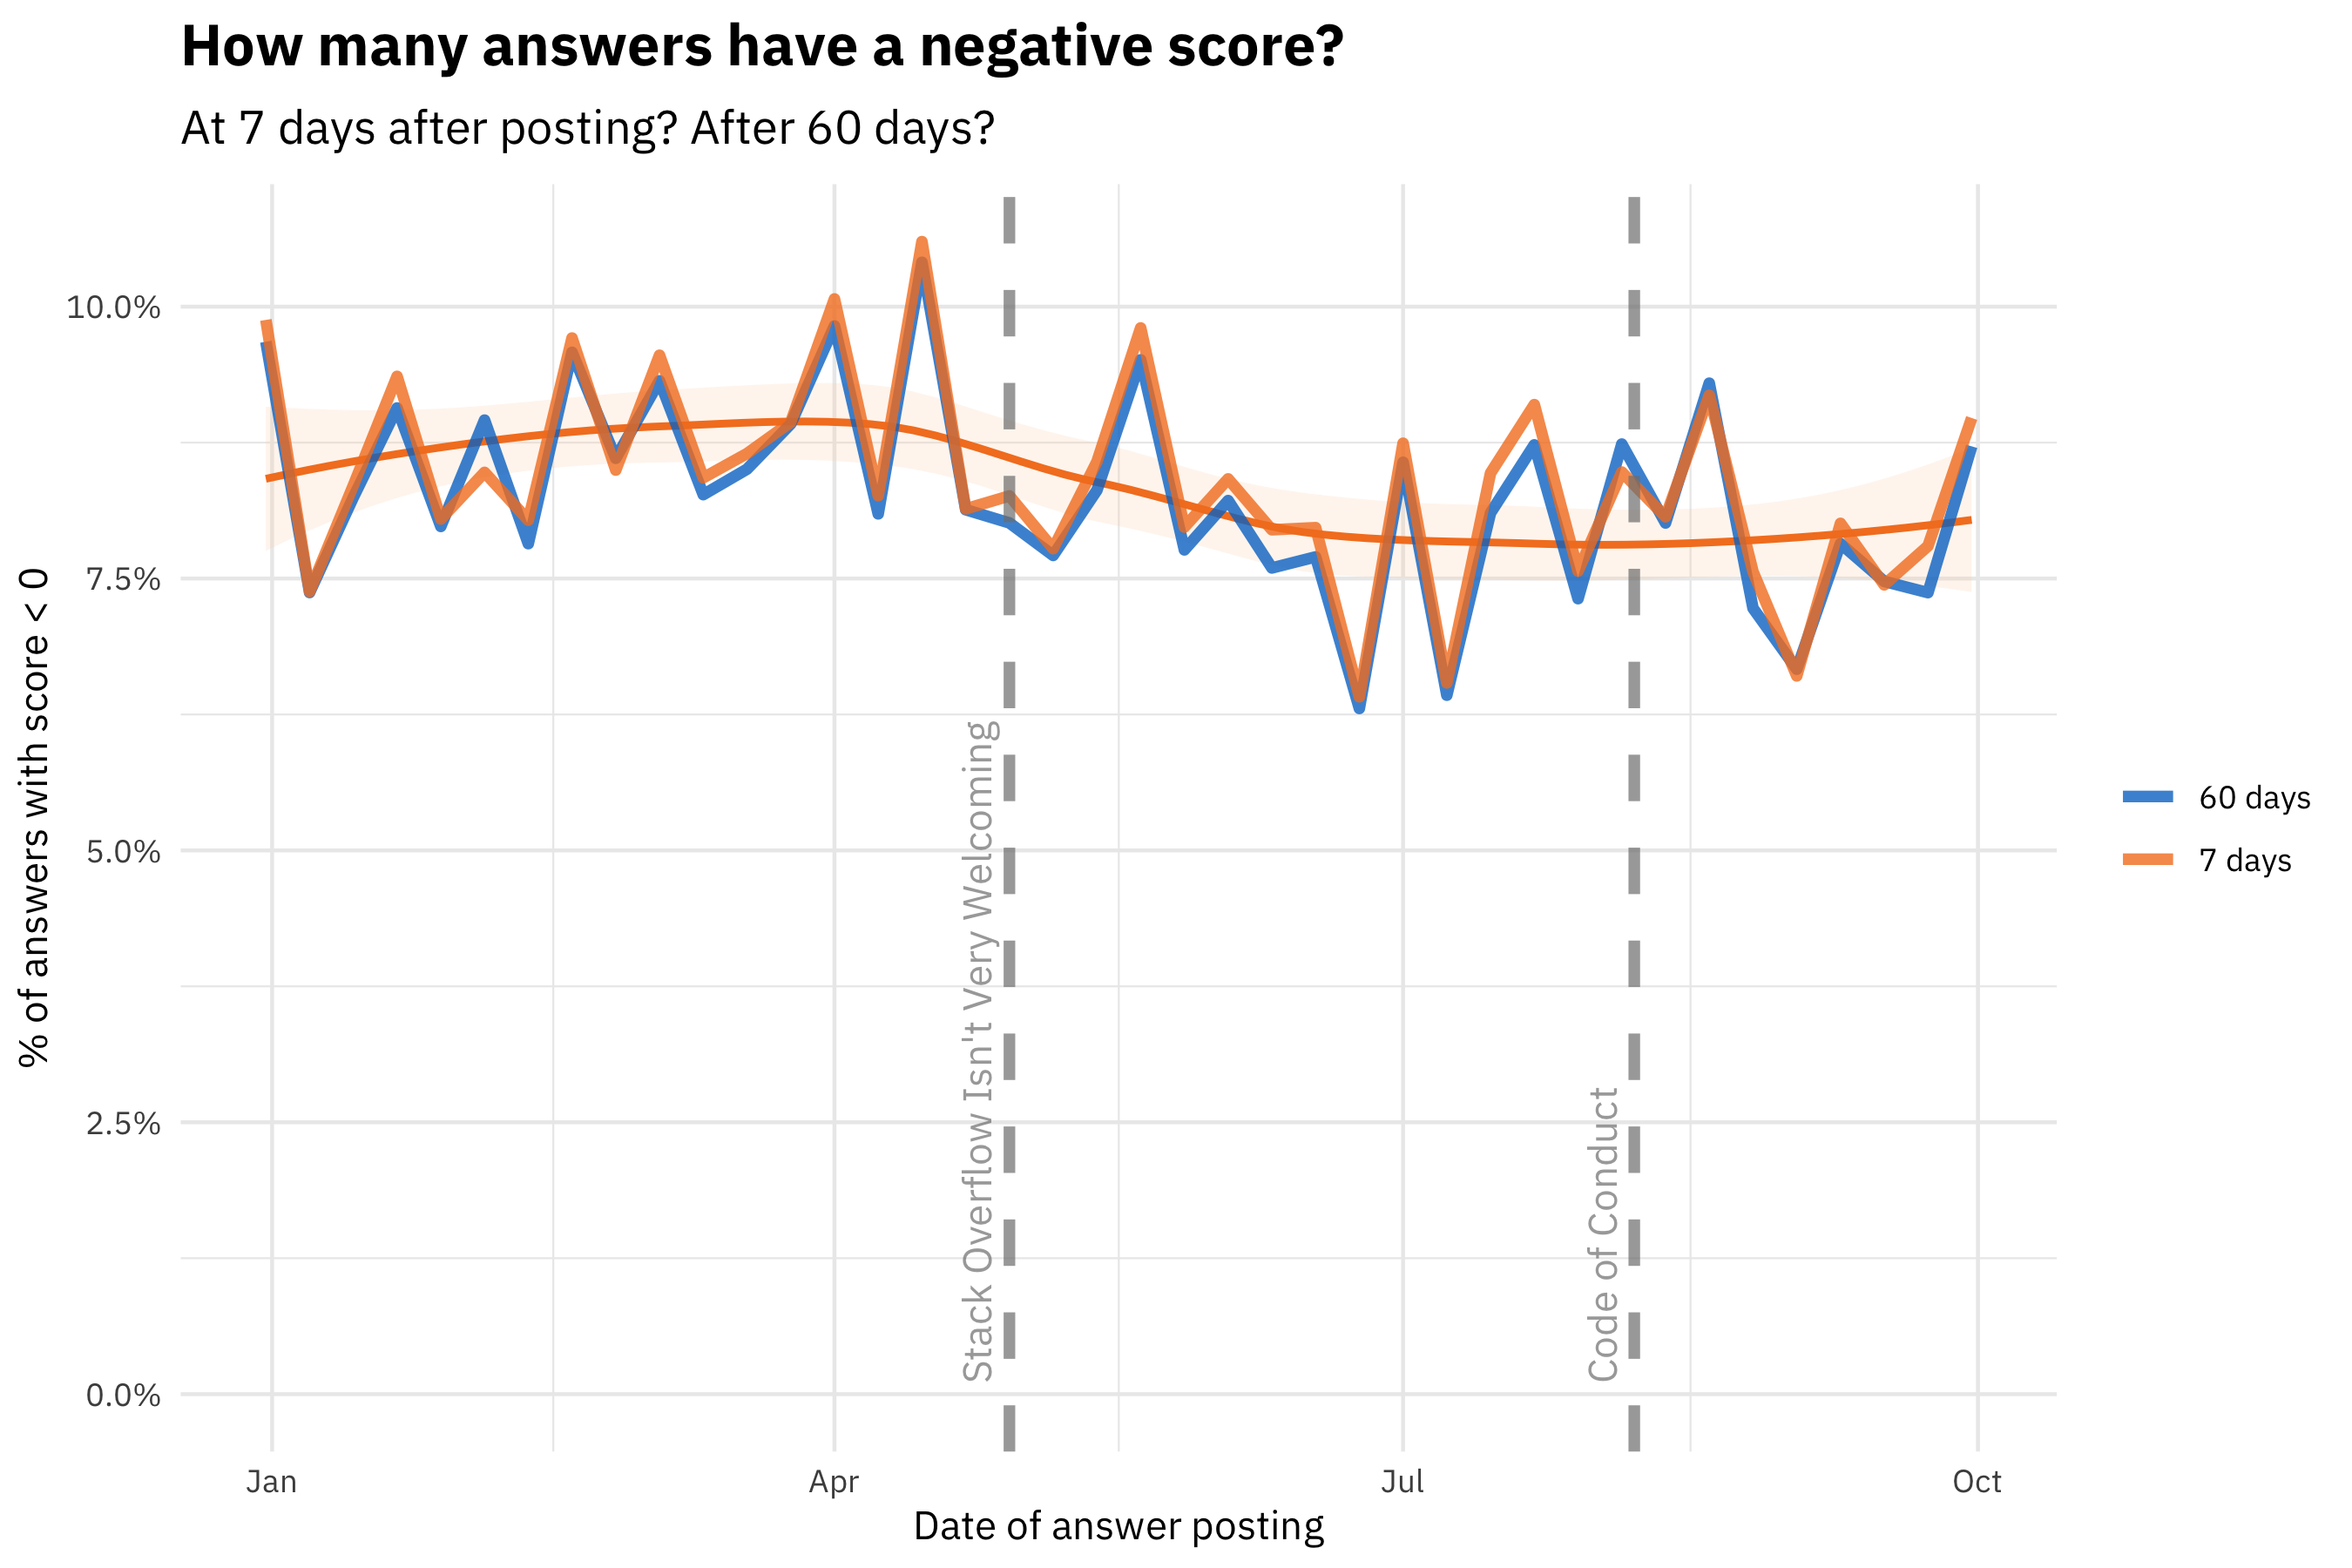
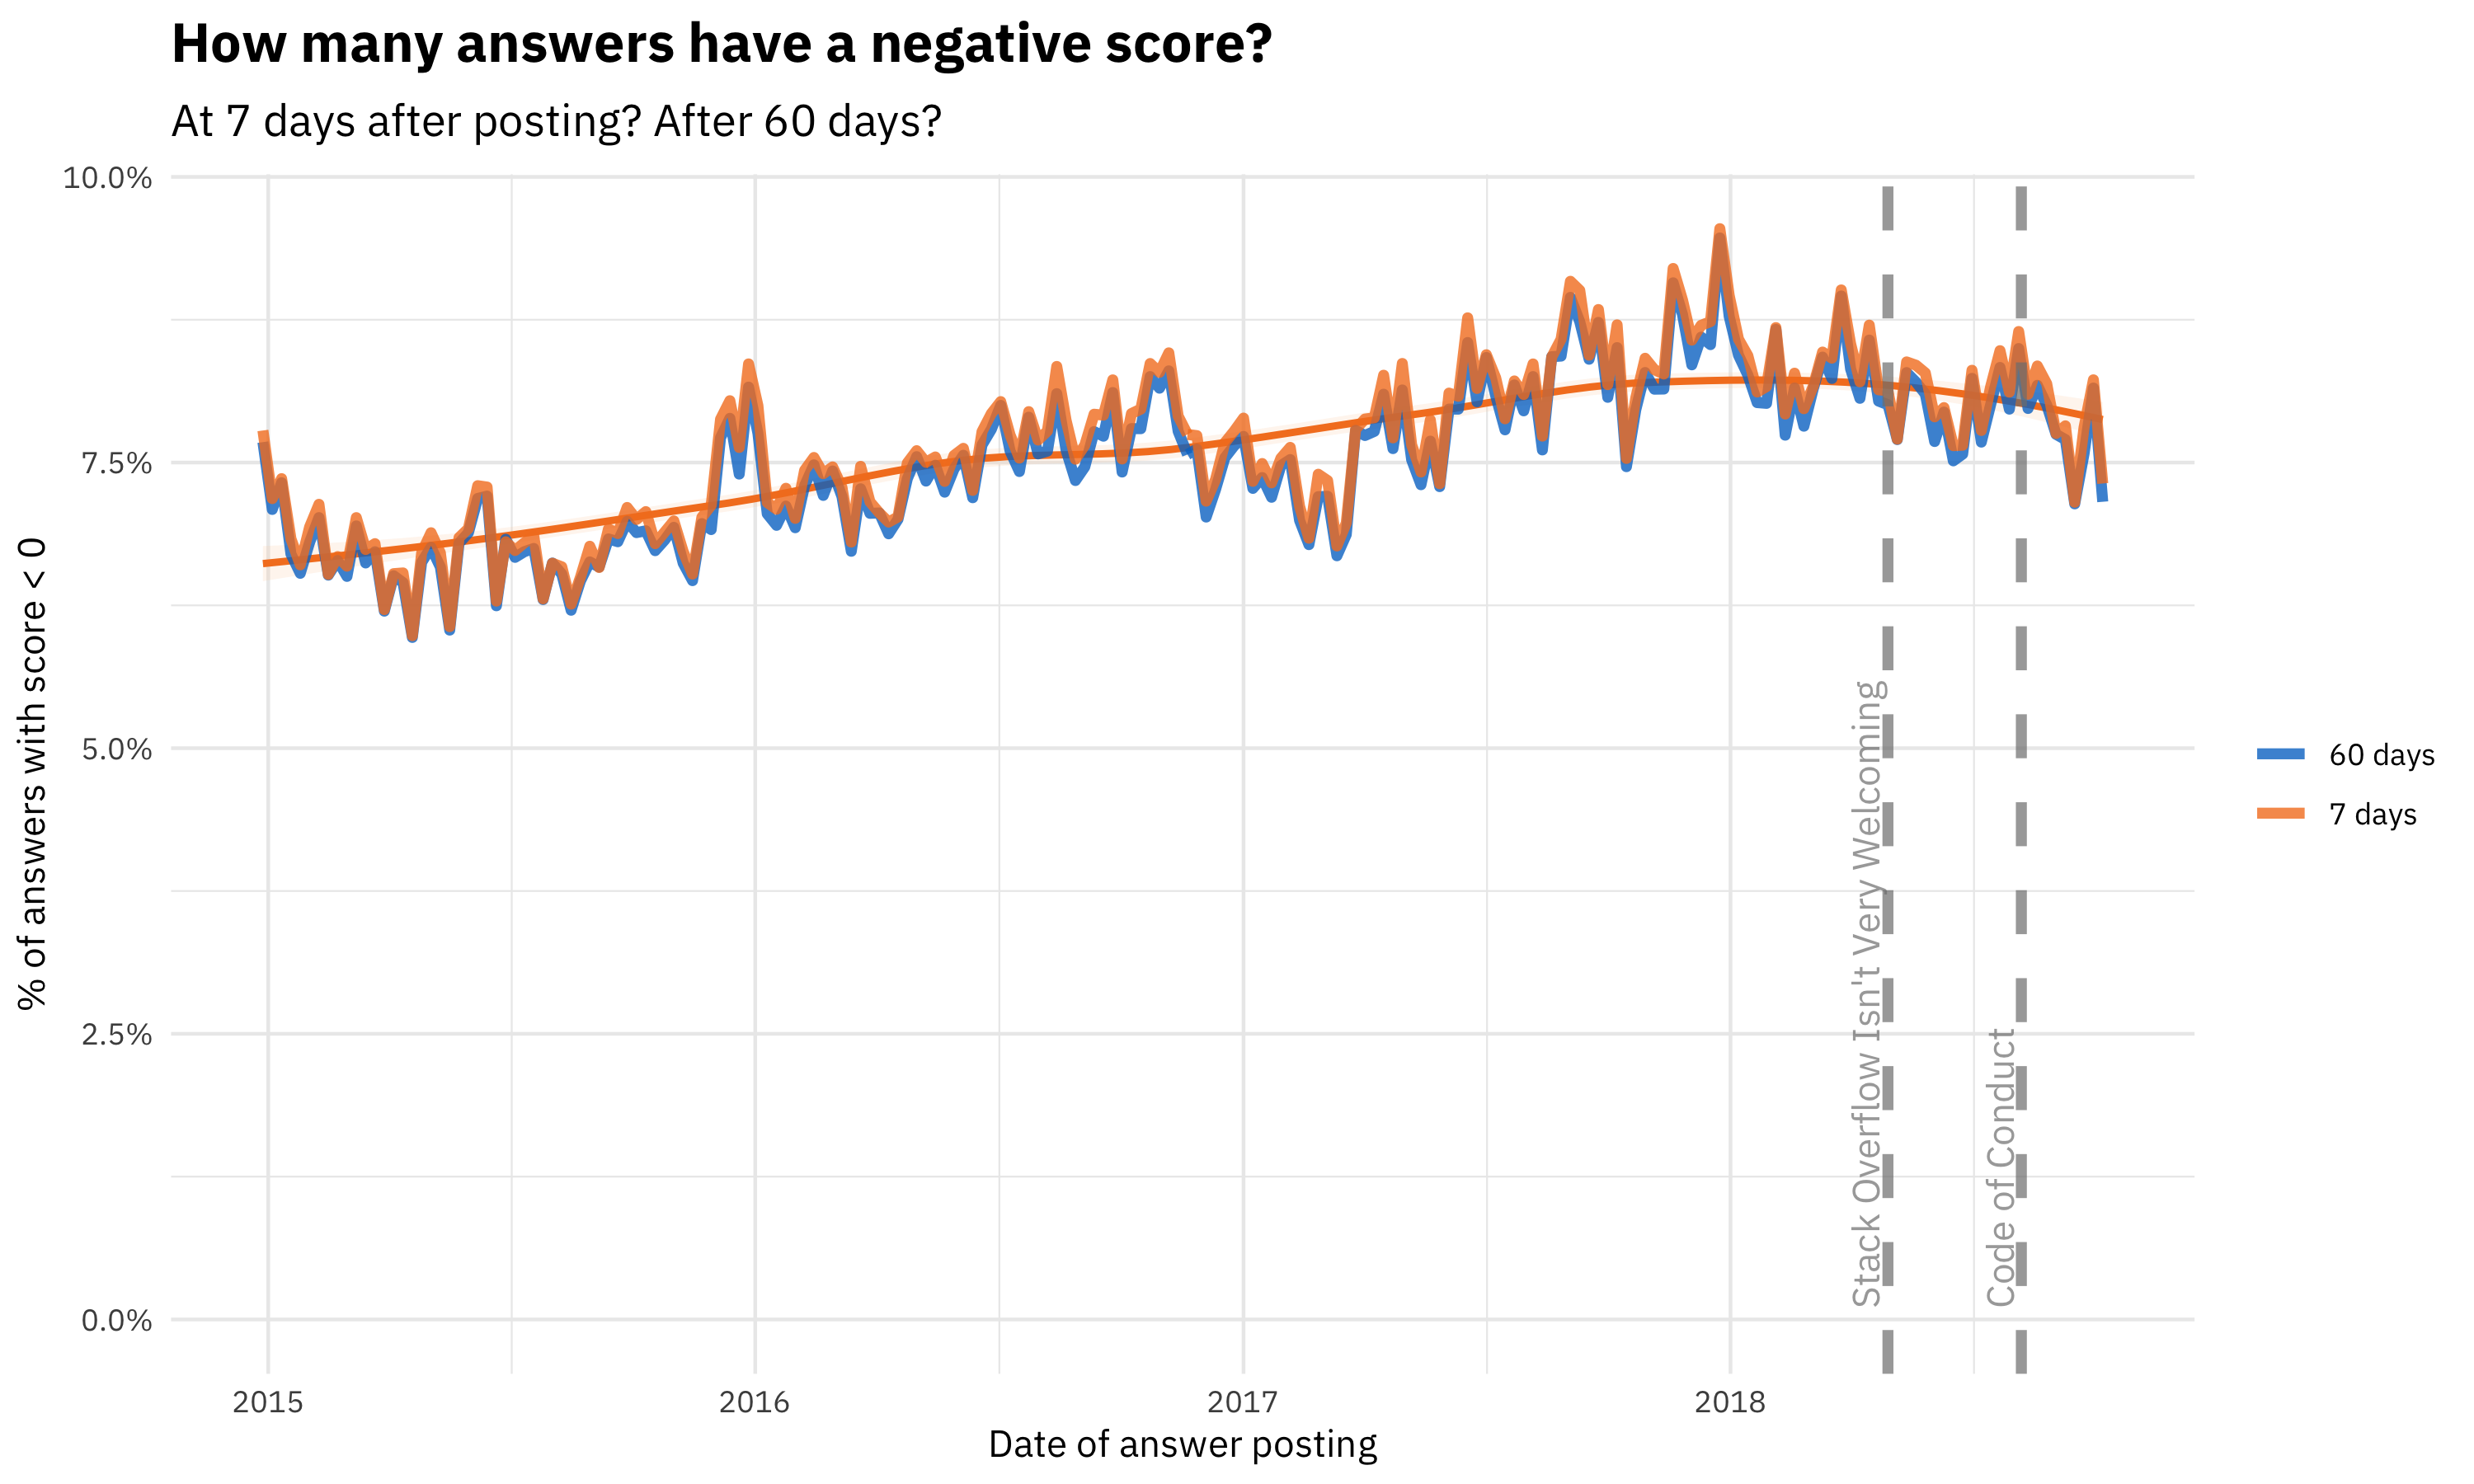
There are several differences for the answers that have a negative score, compared to the positive ones. There isn't much difference between 7 days and 60 days after posting, indicating that new unhelpful answers aren't being "discovered" or identified the way new helpful answers are. Also, the overall proportion is much lower; more questions are identified as helpful through a positive score than unhelpful through a negative score by about 4 or 5 times.
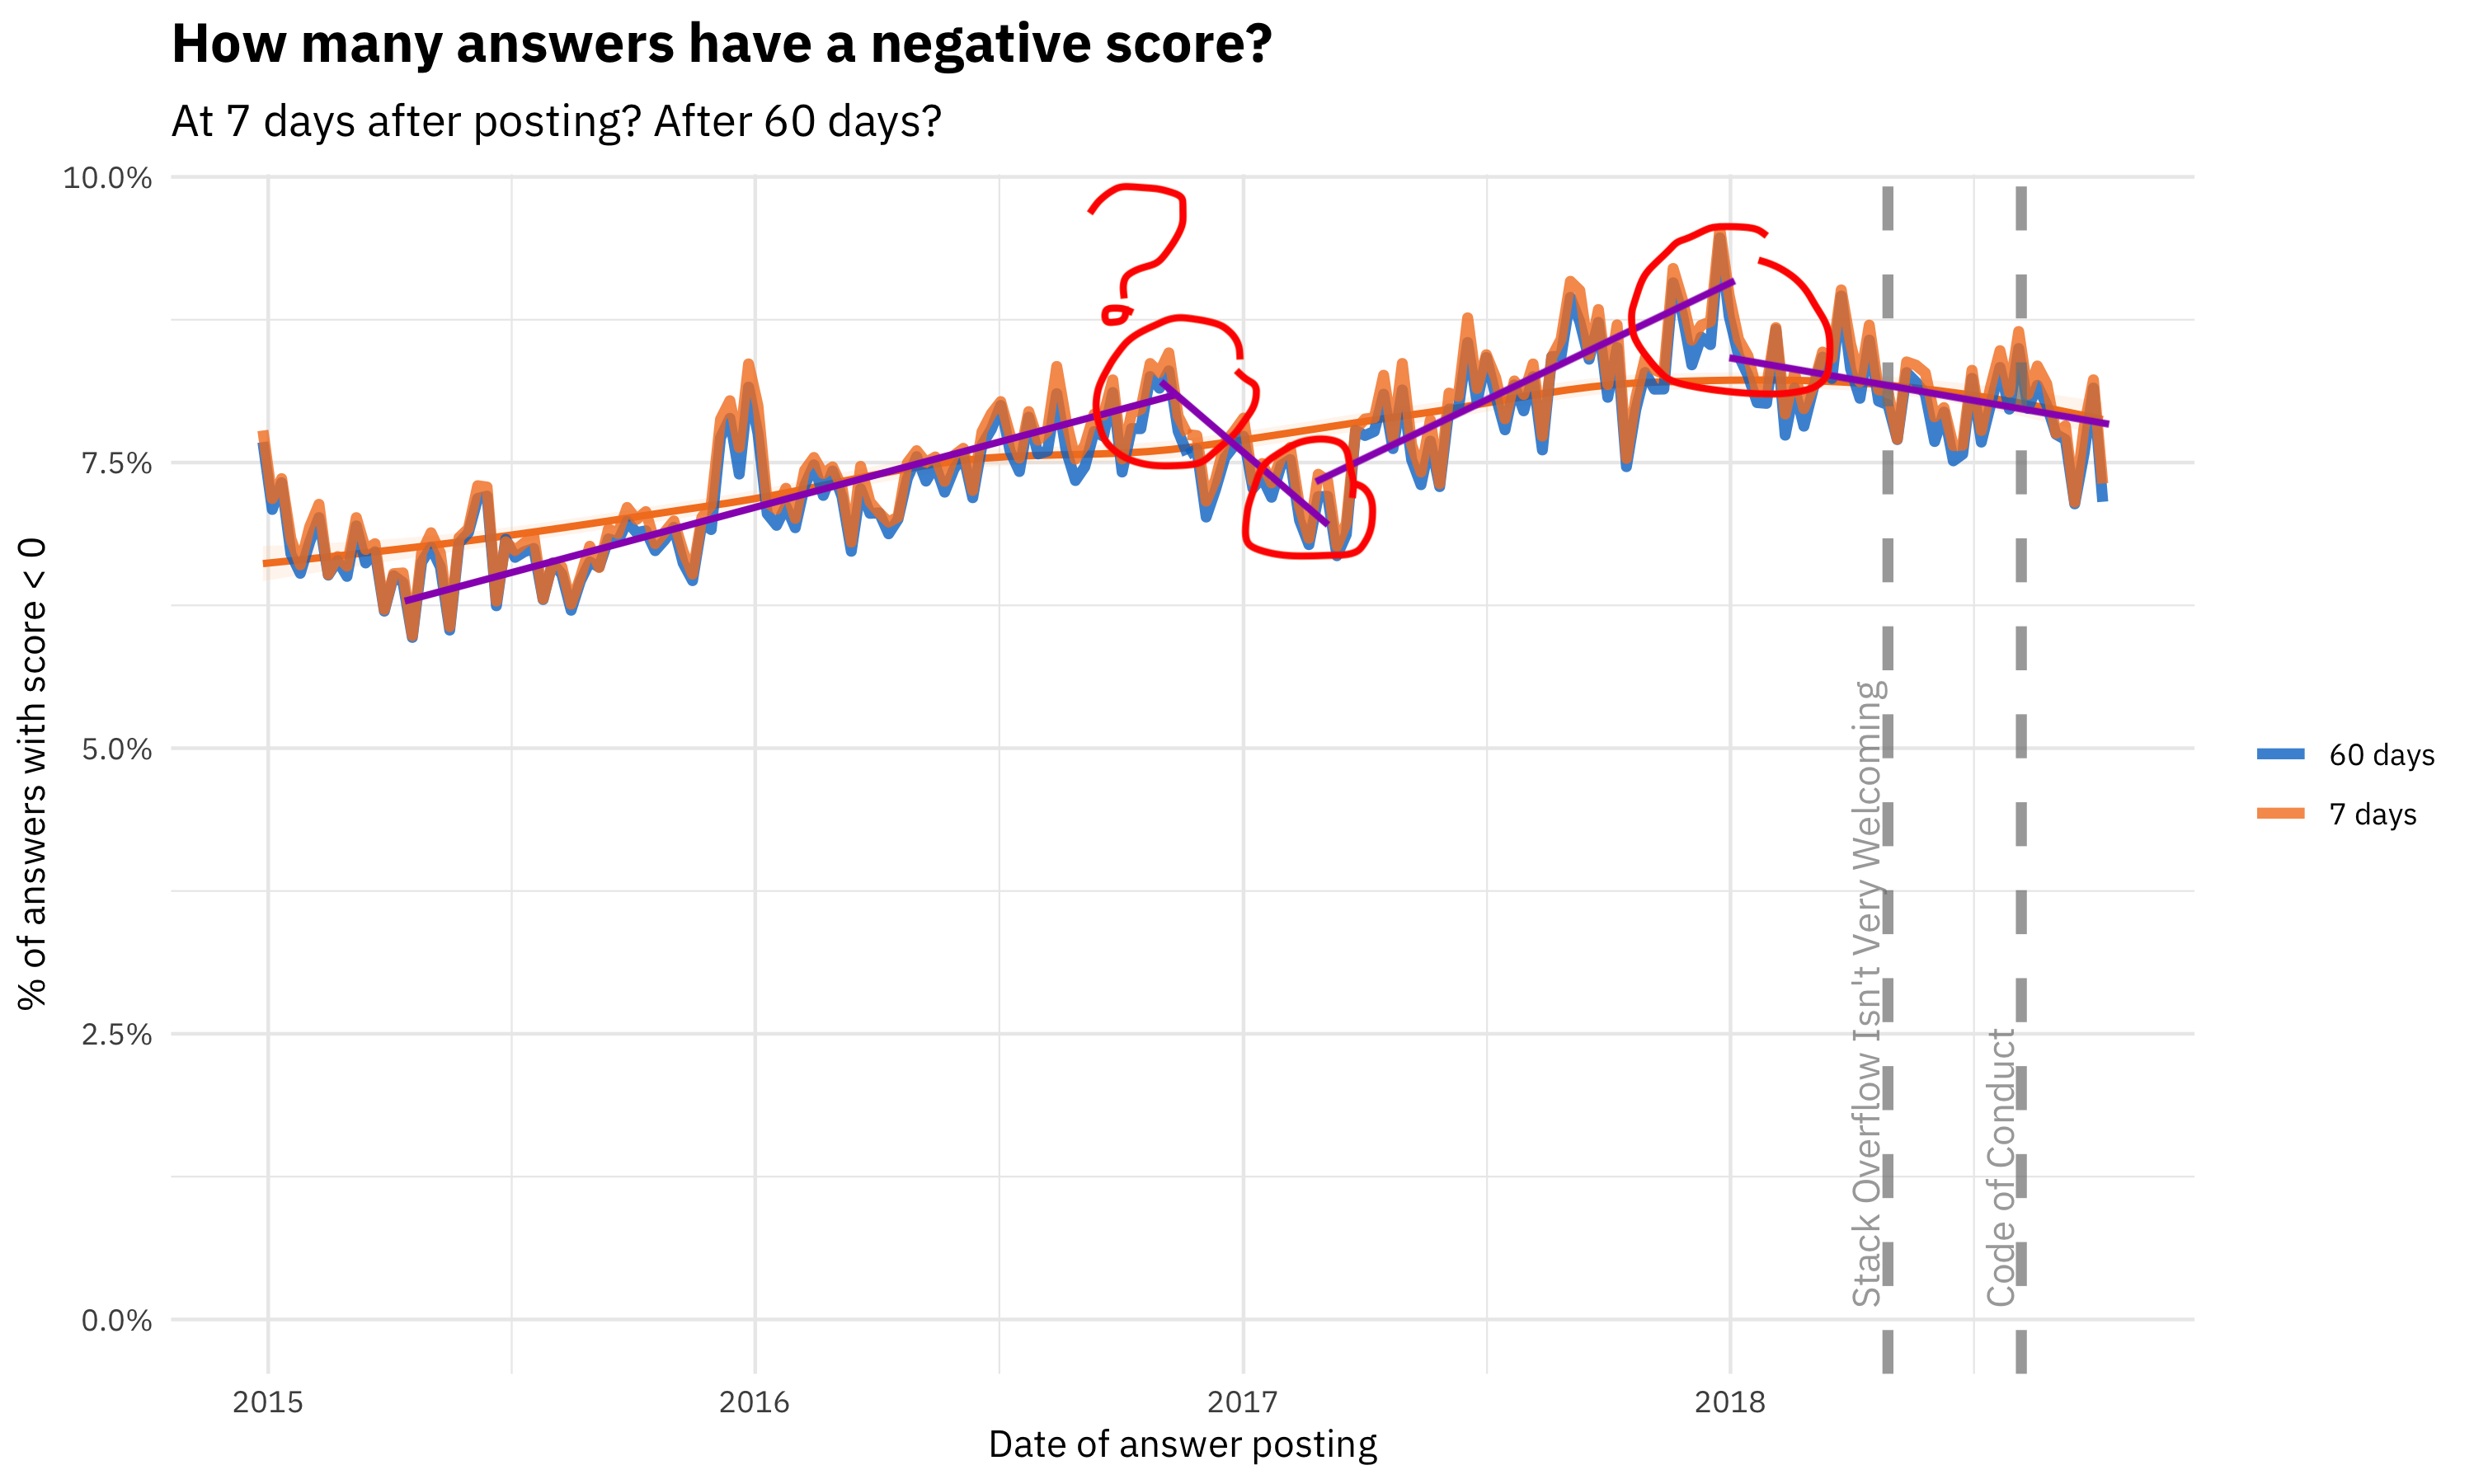
Why I chose to include this analysis is that we can see some evidence of change with time here. The proportion of answers with a negative score appears lower after Jay's blog post than before. How much lower? Using a t-test, about 1% lower, dropping from about 9% to about 8% (p<<0.05).
The p-value says this is unlikely to be a random effect, but let's think about this a little more. I did just tell you that I looked at a lot of different metrics on Stack Overflow, which means we should worry about multiple comparisons. On the other hand, this small shift is robust to subsampling approaches. I think it's likely to be real.
So what does a small shift in answer downvoting like this mean? Is it good news or bad news? I am quite confident that opinions will differ, but paired with the lack of change in answer upvoting, question voting, question quality, question closure, etc. I mostly find it interesting that we can probably measure a change in site behavior from a public statement of values alone. These types of metrics are only a few of the ways we are working to understand and quantify the impact of decisions, and we can share more, if there's interest.
That's this month's slightly-more-than-bite-size data science time! Thoughts? Do you have topic ideas for future data science explorations?


< 0to>= 0.