I've been tracking this for a while; the stats I look at aren't particularly fancy, so I converted them into charts to make them slightly more visually appealing.
Let's start with a big, mostly uninformative chart of how Triage reviews have been completed over the life of the queue:
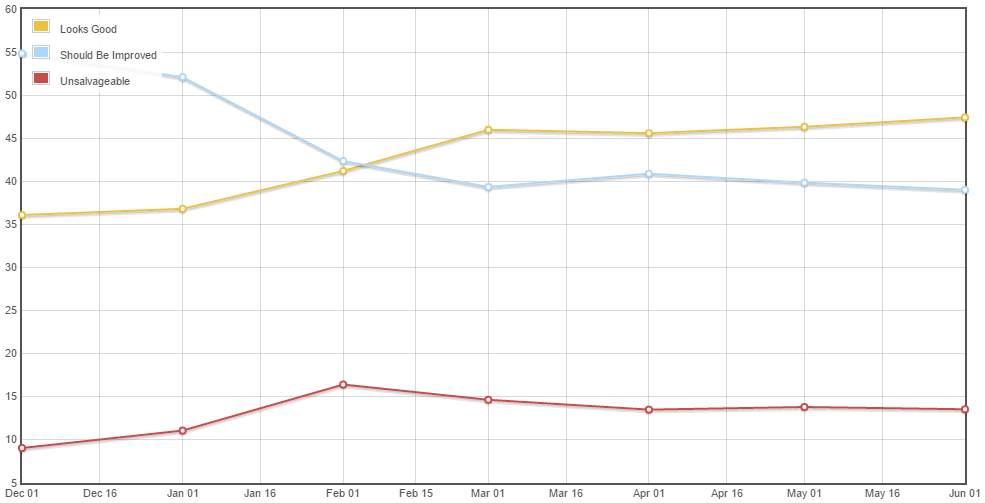
Percentage of triaged questions per consensus category, by month
That big upset in February when the % of questions triaged as "Should Be Improved" went down and the other two went up? That's when audits were turned on.
Ok, now let's break that down a bit by category:
Looks OK
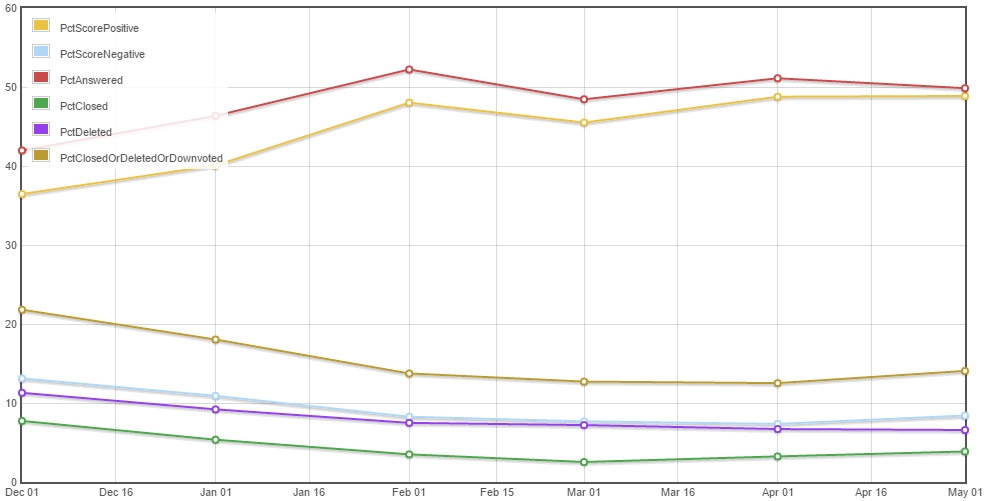
Following the introduction of audits, roughly half of these are being answered and roughly half end up positively-scored. 14% or less are downvoted, closed or deleted.
Let's look a bit further and see why ~4% of these are being closed:
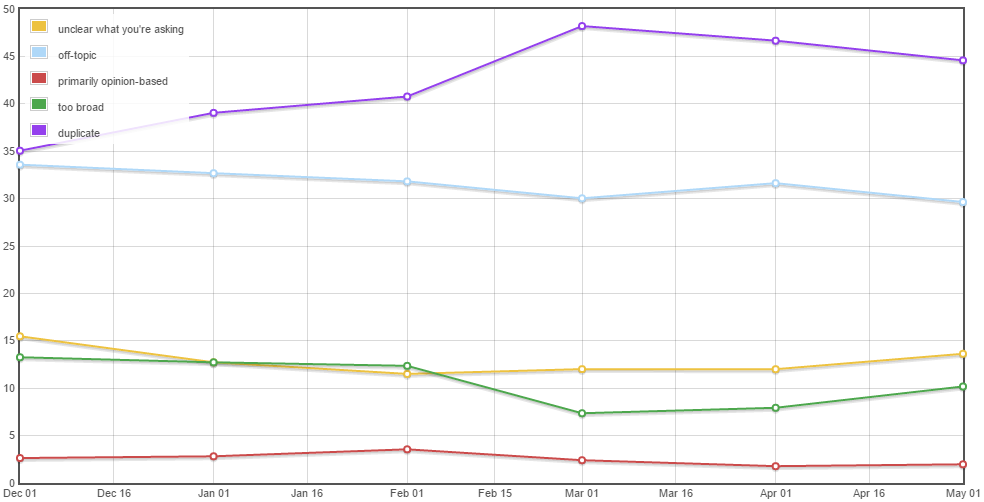
As you suspected, duplicates are by far the biggest contributor here, with a nice bump in March with the introduction of fast closing for asker-confirmed duplicates.
Clearly not every question that gets deleted is closed first... So let's break down the various reasons for which questions triaged as Looks OK are deleted:
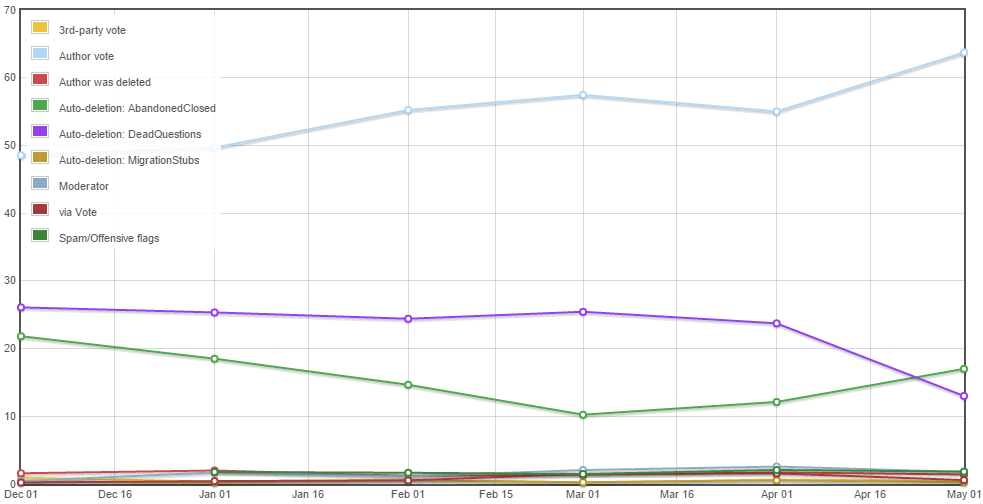
As usual, the single biggest deletionist is the author of the question themselves. Automatic deletion accounts for most of the rest, with the biggest bite taken by the logic that deletes 30-day old, downvoted questions (note the dip at the end - a good chunk of questions triaged in May aren't 30 days old yet).
On to more interesting stats...
Should Be Improved
Questions that end up with this consensus are, as one would expect, a decidedly mixed bag:
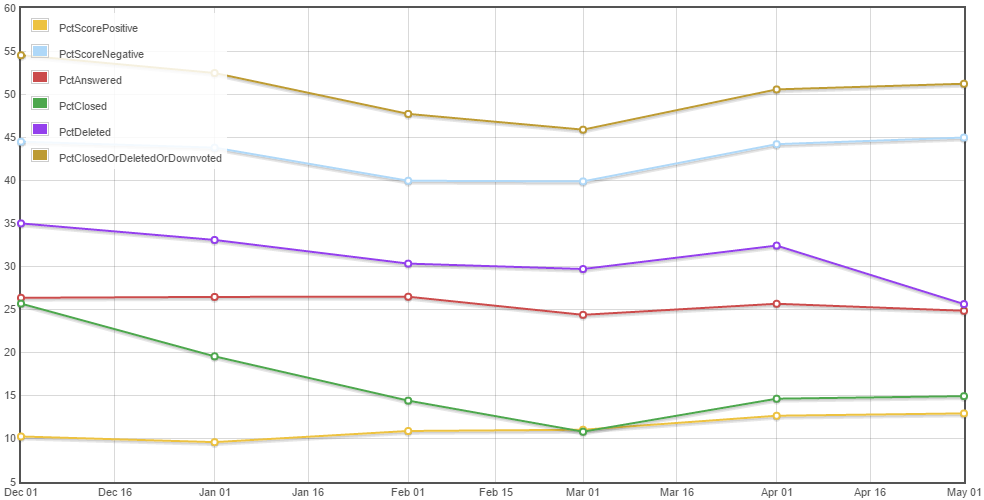
The two lines you want to really focus on there are Deleted and Answered, fighting it out between 25% and 35%. As Tim noted, we're currently running some tests on the Help and Improvement review queue. But not every question triaged as Should Be Improved ends up in that queue; an awful lot of questions get deleted or heavily downvoted before they get that far and quietly float out to sea.
Resisting the urge to ramble on about answers to awful questions that no one wants to fix, I move on here to a breakdown of those closures and deletions...
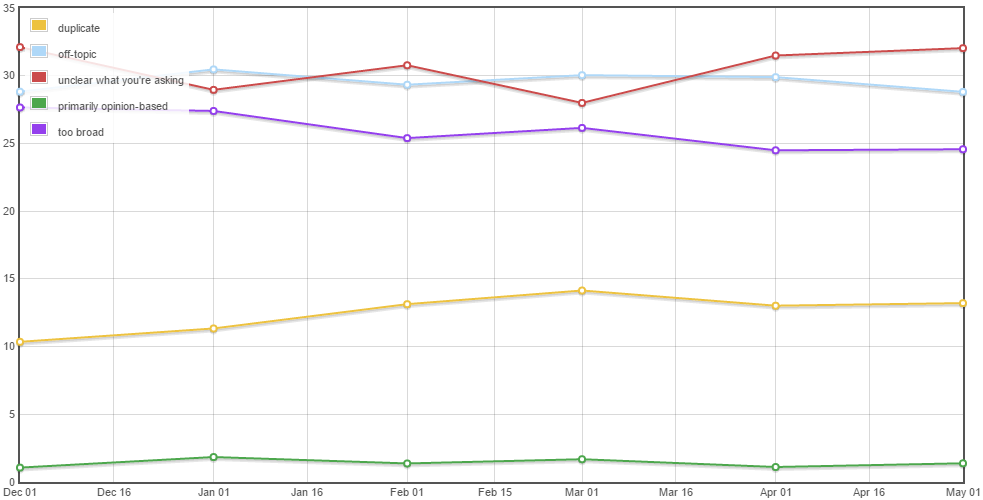
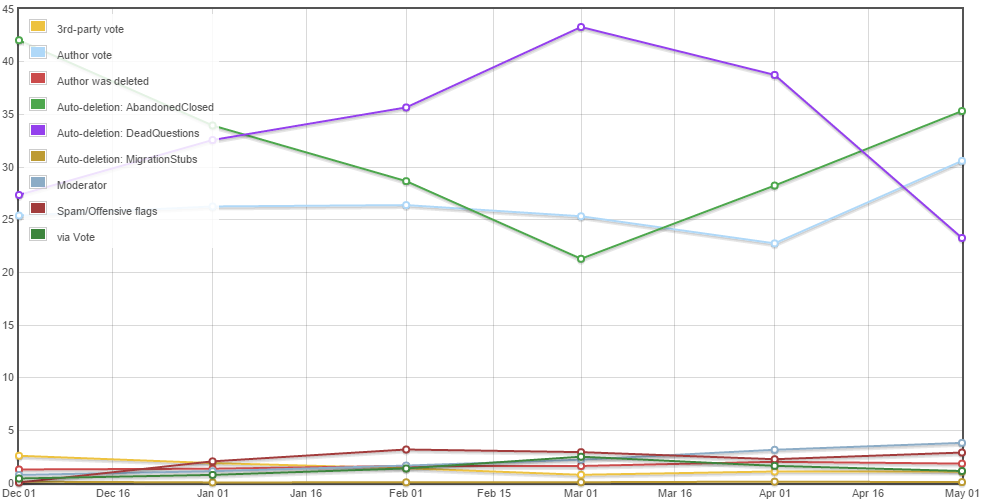
None of this should be particularly surprising if you've seen the close stats and those for deletion. So that leaves only...
Unsalvageable
The outcomes shouldn't surprise you here...
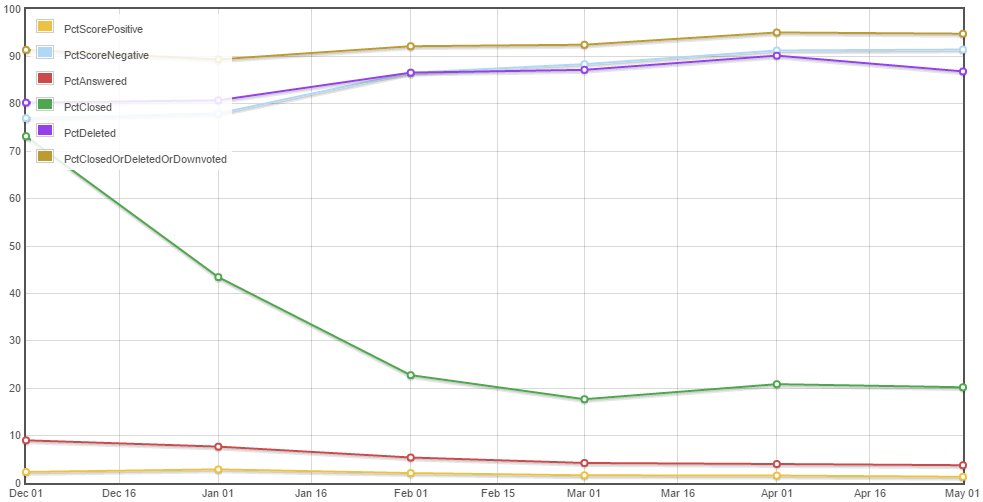
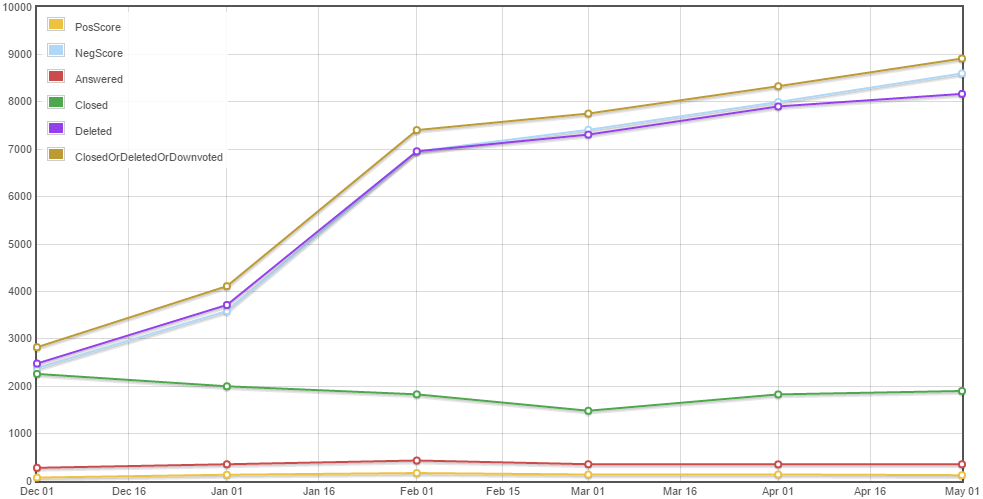
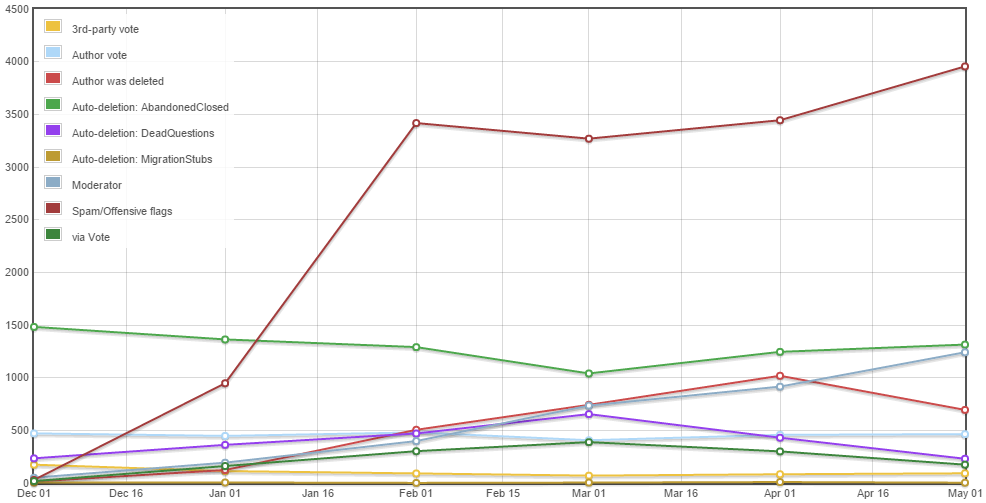
...but what might is the vast gulf between closing and deletion. Well, kinda hard to close stuff if it gets deleted first...
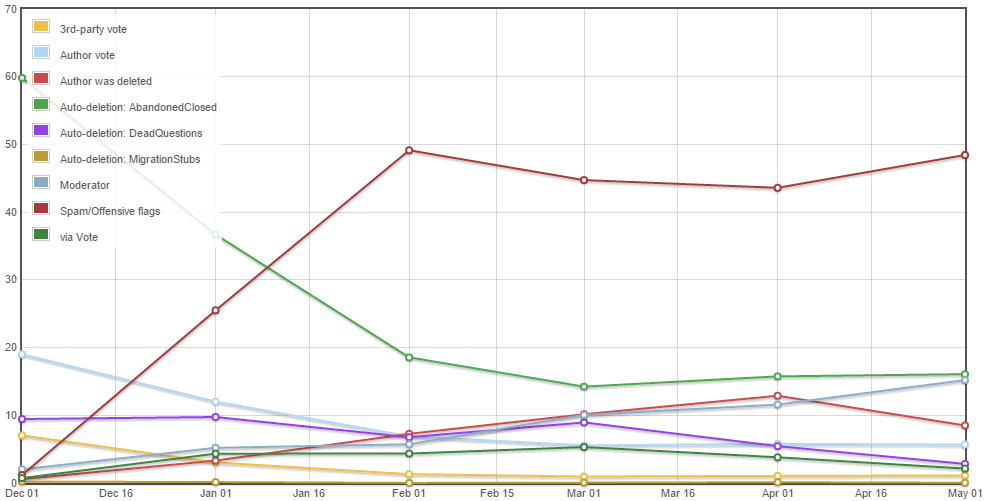
I'm not gonna bother including the close reason breakout for this category, because... It's boring. Instead, I'm going to include the previous two graphs with raw numbers instead of percentages, because percentages are particularly misleading here...
TODO: stacked area charts...
As you can see, closing has remained pretty steady... But spam-deletion has gone way, waaaay up since the introduction of audits. Which makes sense: the audits are largely based on spam.
In closing
I'm gonna try to keep my conclusions reasonably conservative here; this isn't a complete picture, and it is entirely too easy to let the imagination wander... That said, I think it's safe to say that...
...Looks OK classifications are largely... OK... But not exactly enthralling. It's worth keeping in mind that these are the roughly 45% best of the roughly 20% worst questions coming into the system.
...Should Be Improved is pretty effectively capturing the mediocre middle. Unfortunately, the system isn't processing these as well as it should be: if they can't be answered and answered well, they should be removed, not left forgotten like lost souls to haunt the place. More on this after I'm done compiling the results of the H&I queue test.
...Unsalvageable is working pretty well. It is all that I hoped for when I lamented the worthlessness of the First Posts queue.


