73

Is there data available on the results of the triage queue?

I would be very interested in the number of questions that were once in triage and are now closed/deleted and for whatever reason.

Are most of the question that were voted "Looks good" — yet were closed at some point — duplicates? How many of the good ones were actually not good after all?

And maybe even more interesting: what are the numbers for "Should be Improved" and "Unsalvageable"?

If a time resolution is possible, that would be also very interesting: did our classification rates change due to the "Help & Improvement" Crisis and did we improve our triage voting over the last few months?

2
  • 2
    The first question is I think answered here meta.stackoverflow.com/questions/293457/… Commented Jun 16, 2015 at 21:10
  • I think it would be also interesting to know the amount of "Unsalvageable" that got their flags disputed and the amount of "Should be Improved" that were closed in the end.
    – Dzyann
    Commented Jun 18, 2015 at 12:01

2 Answers 2

55

I've been tracking this for a while; the stats I look at aren't particularly fancy, so I converted them into charts to make them slightly more visually appealing.

Let's start with a big, mostly uninformative chart of how Triage reviews have been completed over the life of the queue:
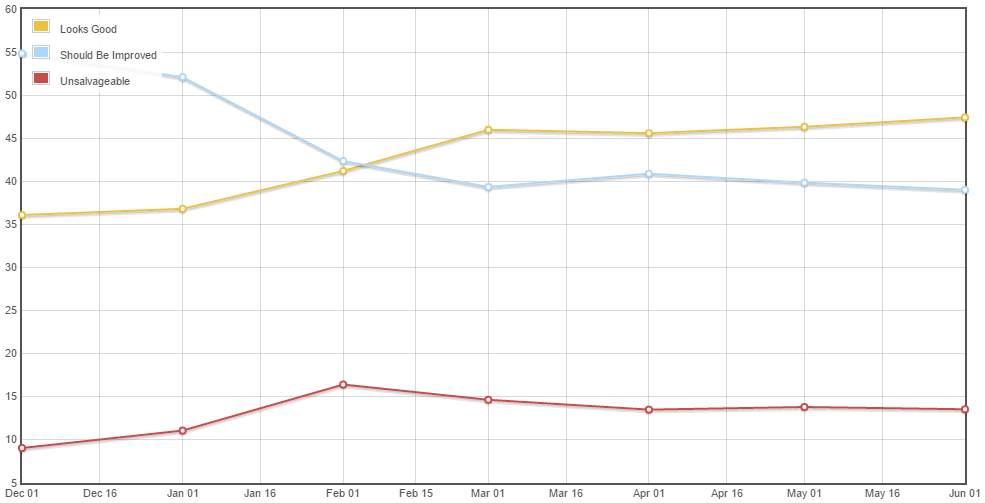
Percentage of triaged questions per consensus category, by month

Percentage of triaged questions per consensus category, by month

That big upset in February when the % of questions triaged as "Should Be Improved" went down and the other two went up? That's when audits were turned on.

Ok, now let's break that down a bit by category:

Looks OK
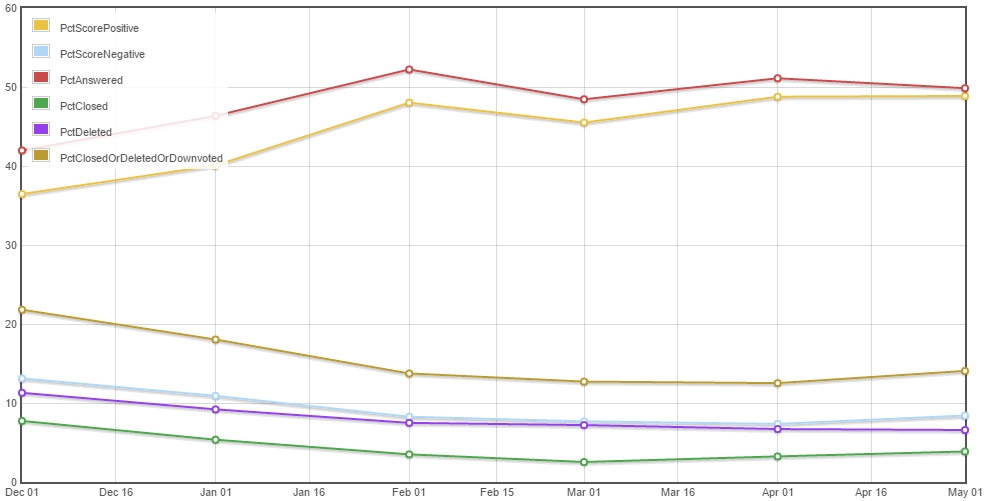
Following the introduction of audits, roughly half of these are being answered and roughly half end up positively-scored. 14% or less are downvoted, closed or deleted.

Let's look a bit further and see why ~4% of these are being closed:
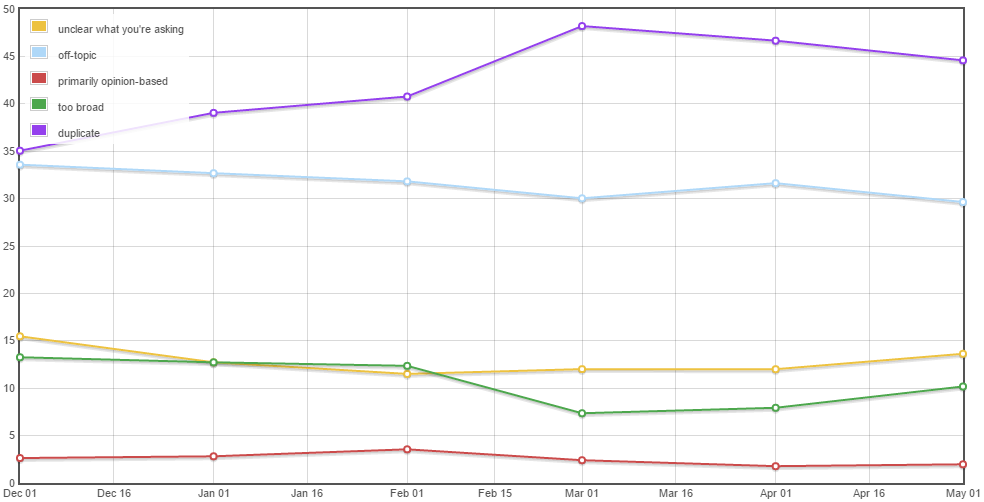
As you suspected, duplicates are by far the biggest contributor here, with a nice bump in March with the introduction of fast closing for asker-confirmed duplicates.

Clearly not every question that gets deleted is closed first... So let's break down the various reasons for which questions triaged as Looks OK are deleted:
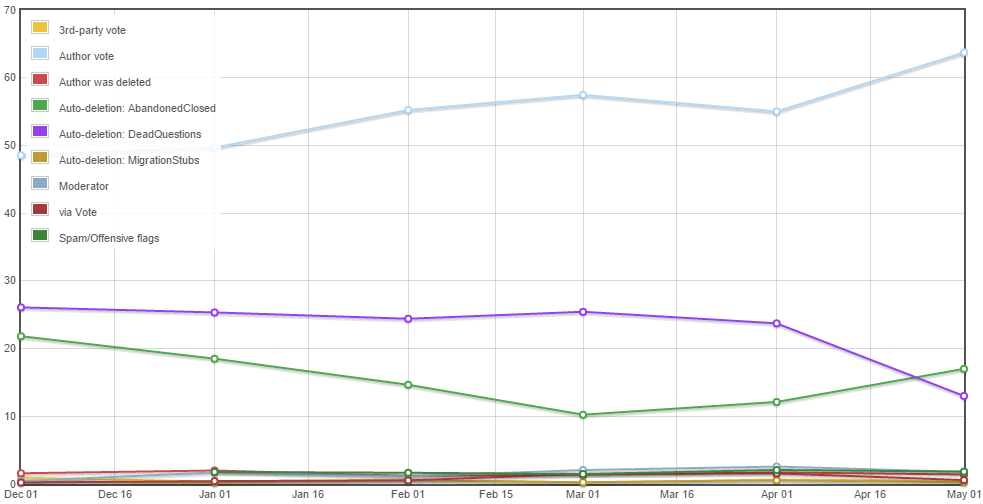
As usual, the single biggest deletionist is the author of the question themselves. Automatic deletion accounts for most of the rest, with the biggest bite taken by the logic that deletes 30-day old, downvoted questions (note the dip at the end - a good chunk of questions triaged in May aren't 30 days old yet).

On to more interesting stats...

Should Be Improved

Questions that end up with this consensus are, as one would expect, a decidedly mixed bag:
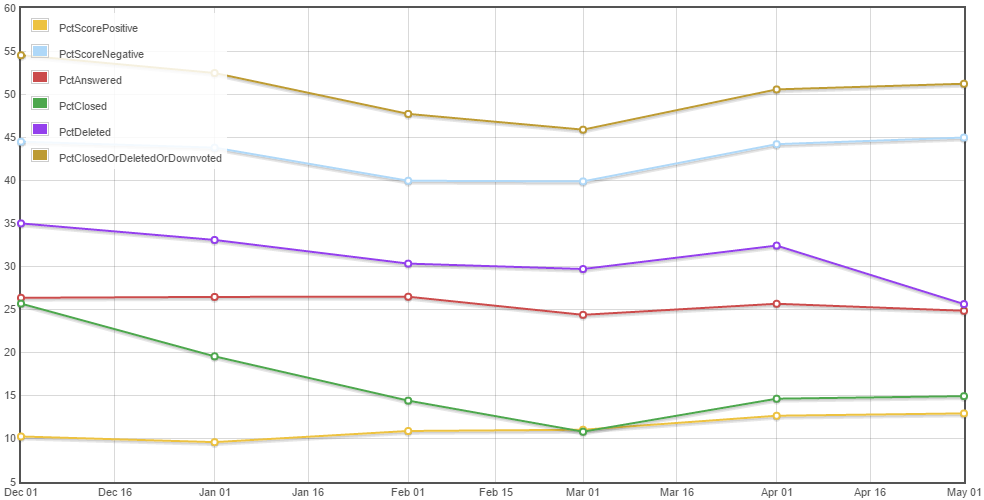
The two lines you want to really focus on there are Deleted and Answered, fighting it out between 25% and 35%. As Tim noted, we're currently running some tests on the Help and Improvement review queue. But not every question triaged as Should Be Improved ends up in that queue; an awful lot of questions get deleted or heavily downvoted before they get that far and quietly float out to sea.

Resisting the urge to ramble on about answers to awful questions that no one wants to fix, I move on here to a breakdown of those closures and deletions...
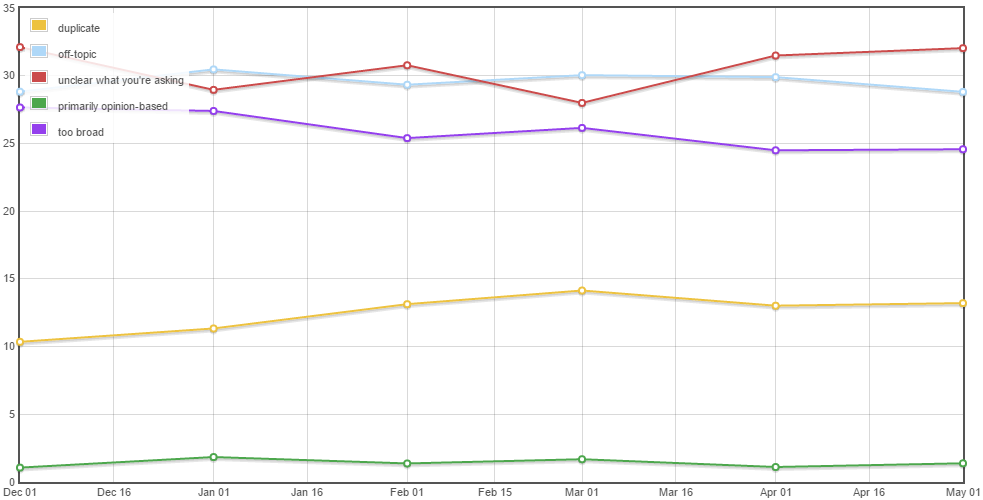
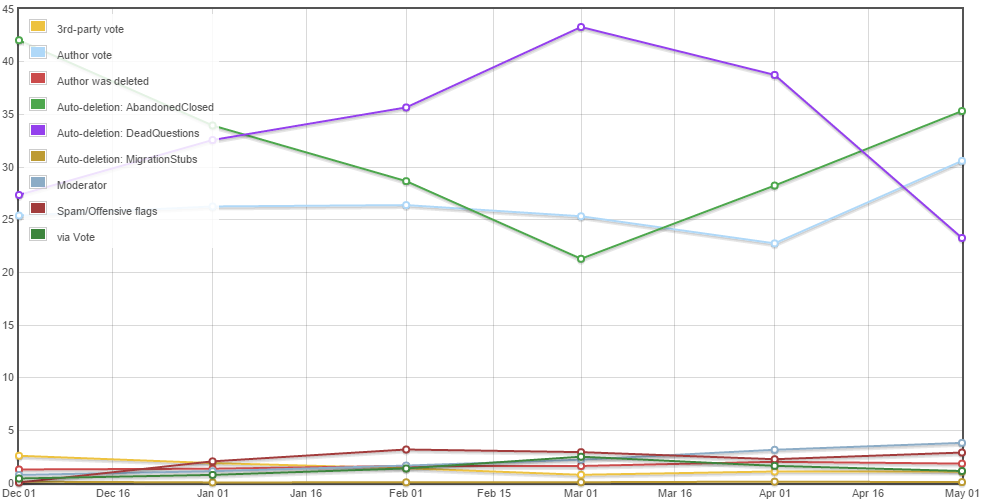
None of this should be particularly surprising if you've seen the close stats and those for deletion. So that leaves only...

Unsalvageable

The outcomes shouldn't surprise you here...
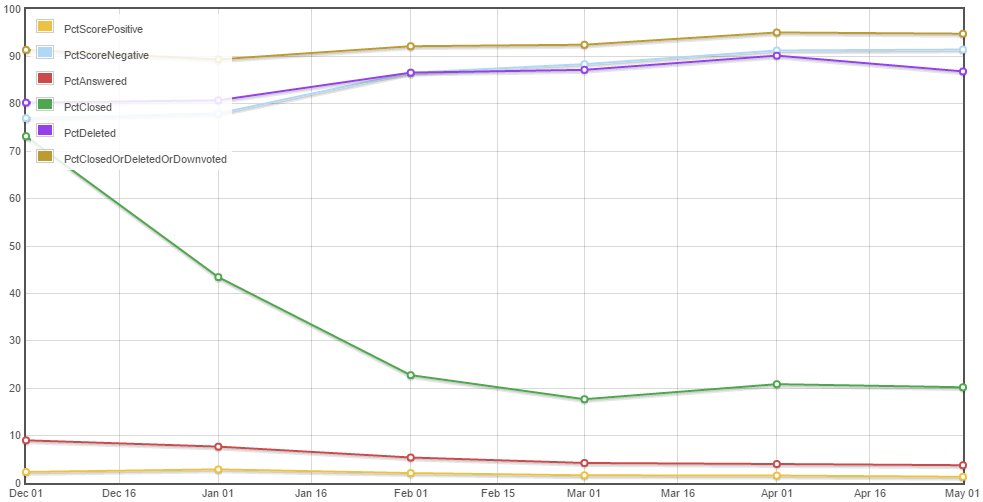
...but what might is the vast gulf between closing and deletion. Well, kinda hard to close stuff if it gets deleted first...
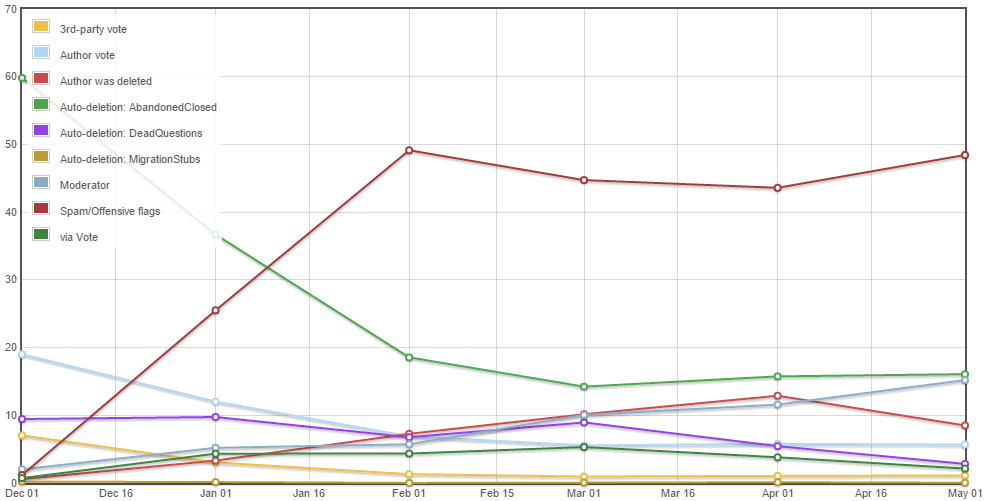
I'm not gonna bother including the close reason breakout for this category, because... It's boring. Instead, I'm going to include the previous two graphs with raw numbers instead of percentages, because percentages are particularly misleading here...
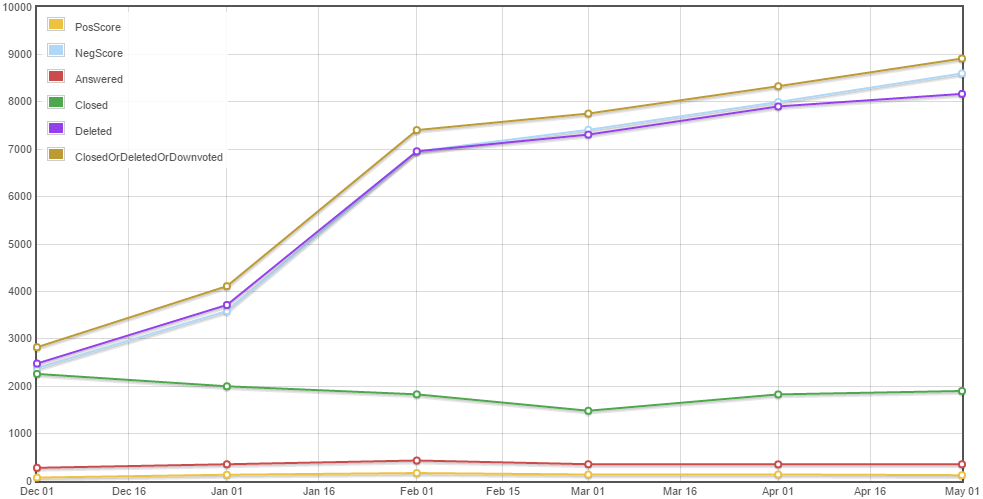
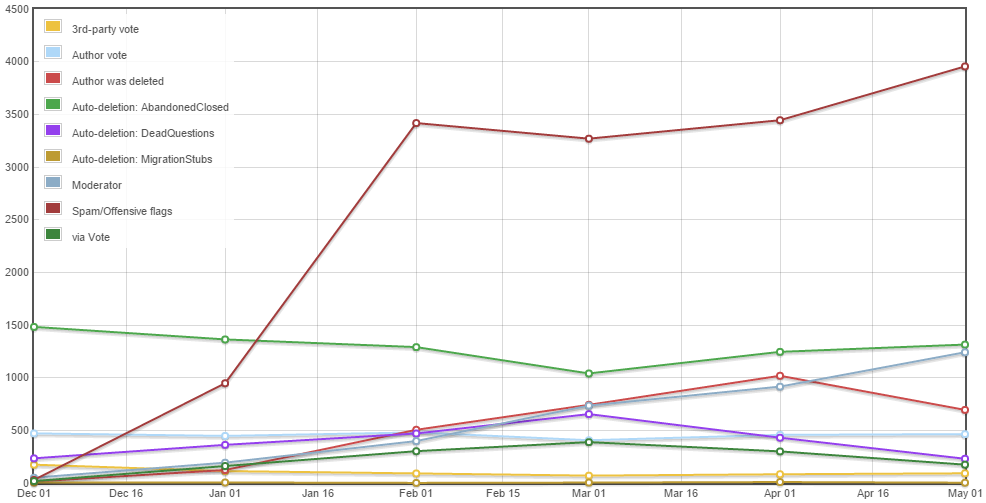
TODO: stacked area charts...

As you can see, closing has remained pretty steady... But spam-deletion has gone way, waaaay up since the introduction of audits. Which makes sense: the audits are largely based on spam.

In closing

I'm gonna try to keep my conclusions reasonably conservative here; this isn't a complete picture, and it is entirely too easy to let the imagination wander... That said, I think it's safe to say that...

  • ...Looks OK classifications are largely... OK... But not exactly enthralling. It's worth keeping in mind that these are the roughly 45% best of the roughly 20% worst questions coming into the system.

  • ...Should Be Improved is pretty effectively capturing the mediocre middle. Unfortunately, the system isn't processing these as well as it should be: if they can't be answered and answered well, they should be removed, not left forgotten like lost souls to haunt the place. More on this after I'm done compiling the results of the H&I queue test.

  • ...Unsalvageable is working pretty well. It is all that I hoped for when I lamented the worthlessness of the First Posts queue.

15
  • 11
    The large % of spam/offensive deletions of Unsalvageable posts is partly due to the infamous support phones, but it's still a reason for concern: if spam is 50% of what gets caught, the category isn't catching enough. I'm concerned that spam-heavy audits may be training reviewers to identify Unsalvageable with spam.
    – user3717023
    Commented Jun 18, 2015 at 4:28
  • tl;dr looks about like that: Triage outcomes in Looks OK and Unsalvageable buckets are valuable and go smooth (that's why we only hear complaints about Should Be Improved), and make for a (huge? substantial? noticeable?) improvement over what we had in the past in the "terrible and useless" FP review. Is my understanding correct?
    – gnat
    Commented Jun 18, 2015 at 6:47
  • 2
    Do the numbers change substantially if you disregard votes which were "ecouraged" by the system prompting? Commented Jun 18, 2015 at 11:39
  • 1
    One thing the charts do not say is whether Triage has had any effect on these outcomes. Good questions were answered and bad questions were deleted since 2008.
    – user3717023
    Commented Jun 18, 2015 at 13:51
  • 2
    That's because Triage isn't supposed to be directly affecting the outcome, @HomegrownTomato. Even for "Unsalvageable", the one option where your choices can directly affect the post, the queue doesn't retain the task until it is closed or deleted; once a consensus is reached, it moves on to close review or the mod queue. The primary purpose of triage is to predict, not treat... But, I probably went a bit too far in trying to prevent Triage from affecting the outcome; folks are getting irritated about disputed flags.
    – Shog9
    Commented Jun 18, 2015 at 14:04
  • 1
    Indeed. When a closeflag cast from outside of review, in the normal process of browsing, ends up being disputed because of SBI-clickers in Triage, that's not just irritating, that's directly affecting the outcome.
    – user3717023
    Commented Jun 18, 2015 at 16:35
  • @Shog9, thanks for the amazing graphs. I find the graph for Looks good by closing category a little surprising. Is it a normalizing issue, or does triage have problems with identifying offtopic questions?
    – cel
    Commented Jun 18, 2015 at 17:53
  • No, it means triage is bad at identifying duplicates, @cel. Which is not surprising; duplicates are hard and triage is intended to move quickly.
    – Shog9
    Commented Jun 18, 2015 at 18:27
  • @Shog9, If I had to sketch the graph before seeing the data, I would have predicted that duplicates are high and opinion based, too broad and off topic are much lower and all at roughly the same level. But off topic is almost as high as duplicates.
    – cel
    Commented Jun 18, 2015 at 18:31
  • DUP: ~45%; OT: ~30%, @cel...
    – Shog9
    Commented Jun 18, 2015 at 18:34
  • @Shog9, I may have exaggerated a little :) Do you happen to have a similar plot for all closed questions in this time period? Is OT in general used more often than the other two options?
    – cel
    Commented Jun 18, 2015 at 18:42
  • 1
    Earn 10k, @cel... meta.stackexchange.com/questions/257449/…
    – Shog9
    Commented Jun 18, 2015 at 18:54
  • @HomegrownTomato - please forgive my ignorance... what are the infamous support phones?
    – jww
    Commented Jun 19, 2015 at 2:30
  • 1
    @jww See meta.stackoverflow.com/questions/295964/…
    – user3717023
    Commented Jun 19, 2015 at 2:51
  • FYI: meta.stackoverflow.com/questions/289658/… @NormalHuman.
    – Shog9
    Commented Aug 4, 2015 at 19:17
18

Okay, now that I'm actually talking about the right queue (as 10k users shake their heads) ..

We're running this now. It's complicated, kinda.

We're running numbers on triage 'outcomes' in conjunction with running a ton of numbers on helper queue outcomes, since the two are so closely tied together. This involves some split tests (or, basically holding back 50% of the questions that would otherwise go into the helper queue from triage). Then we can run numbers on both groups.

This not only lets us test how questions that should have gone into the queue fare versus those that actually went in, it also lets us look at what ultimately happened to stuff triage thought should be improved or was unsalvageable, with and without actually going into the queue.

It is an enormous amount of very noisy data.

Shog is going to be posting some preliminary stuff a bit later today, but just discovering what's actually meaningful is still underway. We're going to be making what we mine out of it available as we get it over the coming 30 - 60 days, as questions in both sample groups age.

1
  • 4
    about time to estimate positive impact of Triage? We're well aware of pain it brought so far: incorrectly disputed flags and obstacles in auto-deletion. How can one find out about what we gain? to be able to decide if it is worth the pain
    – gnat
    Commented Jun 17, 2015 at 20:05

You must log in to answer this question.

Not the answer you're looking for? Browse other questions tagged .