130

Welcome to April's installment of the regular, bite-size, data-focused updates I am sharing with Meta! You can check out previous posts by me if you like, as well as March's post from my coworker Donna.

Yesterday, we launched the results of the 2019 Developer Survey; you can read about everything from hours worked per week to issues around underrepresented groups in tech. During my time analyzing the survey data, I found more interesting results than we had space to include in the main report. This month seems like a great time to share one of those here with you all on Meta!

Let's talk MONEY. đź’°

The salary information that we gather in our annual survey is some of the most valuable data in the whole thing, because this gives us a specific insight into our industry that we can't really collect in any other way. We can combine salary data with other characteristics of respondents to build a deep understanding of how developers earn. We use exactly this kind of information for the statistical modeling behind our salary calculator, which will be updated in the upcoming months to use 2019 data.

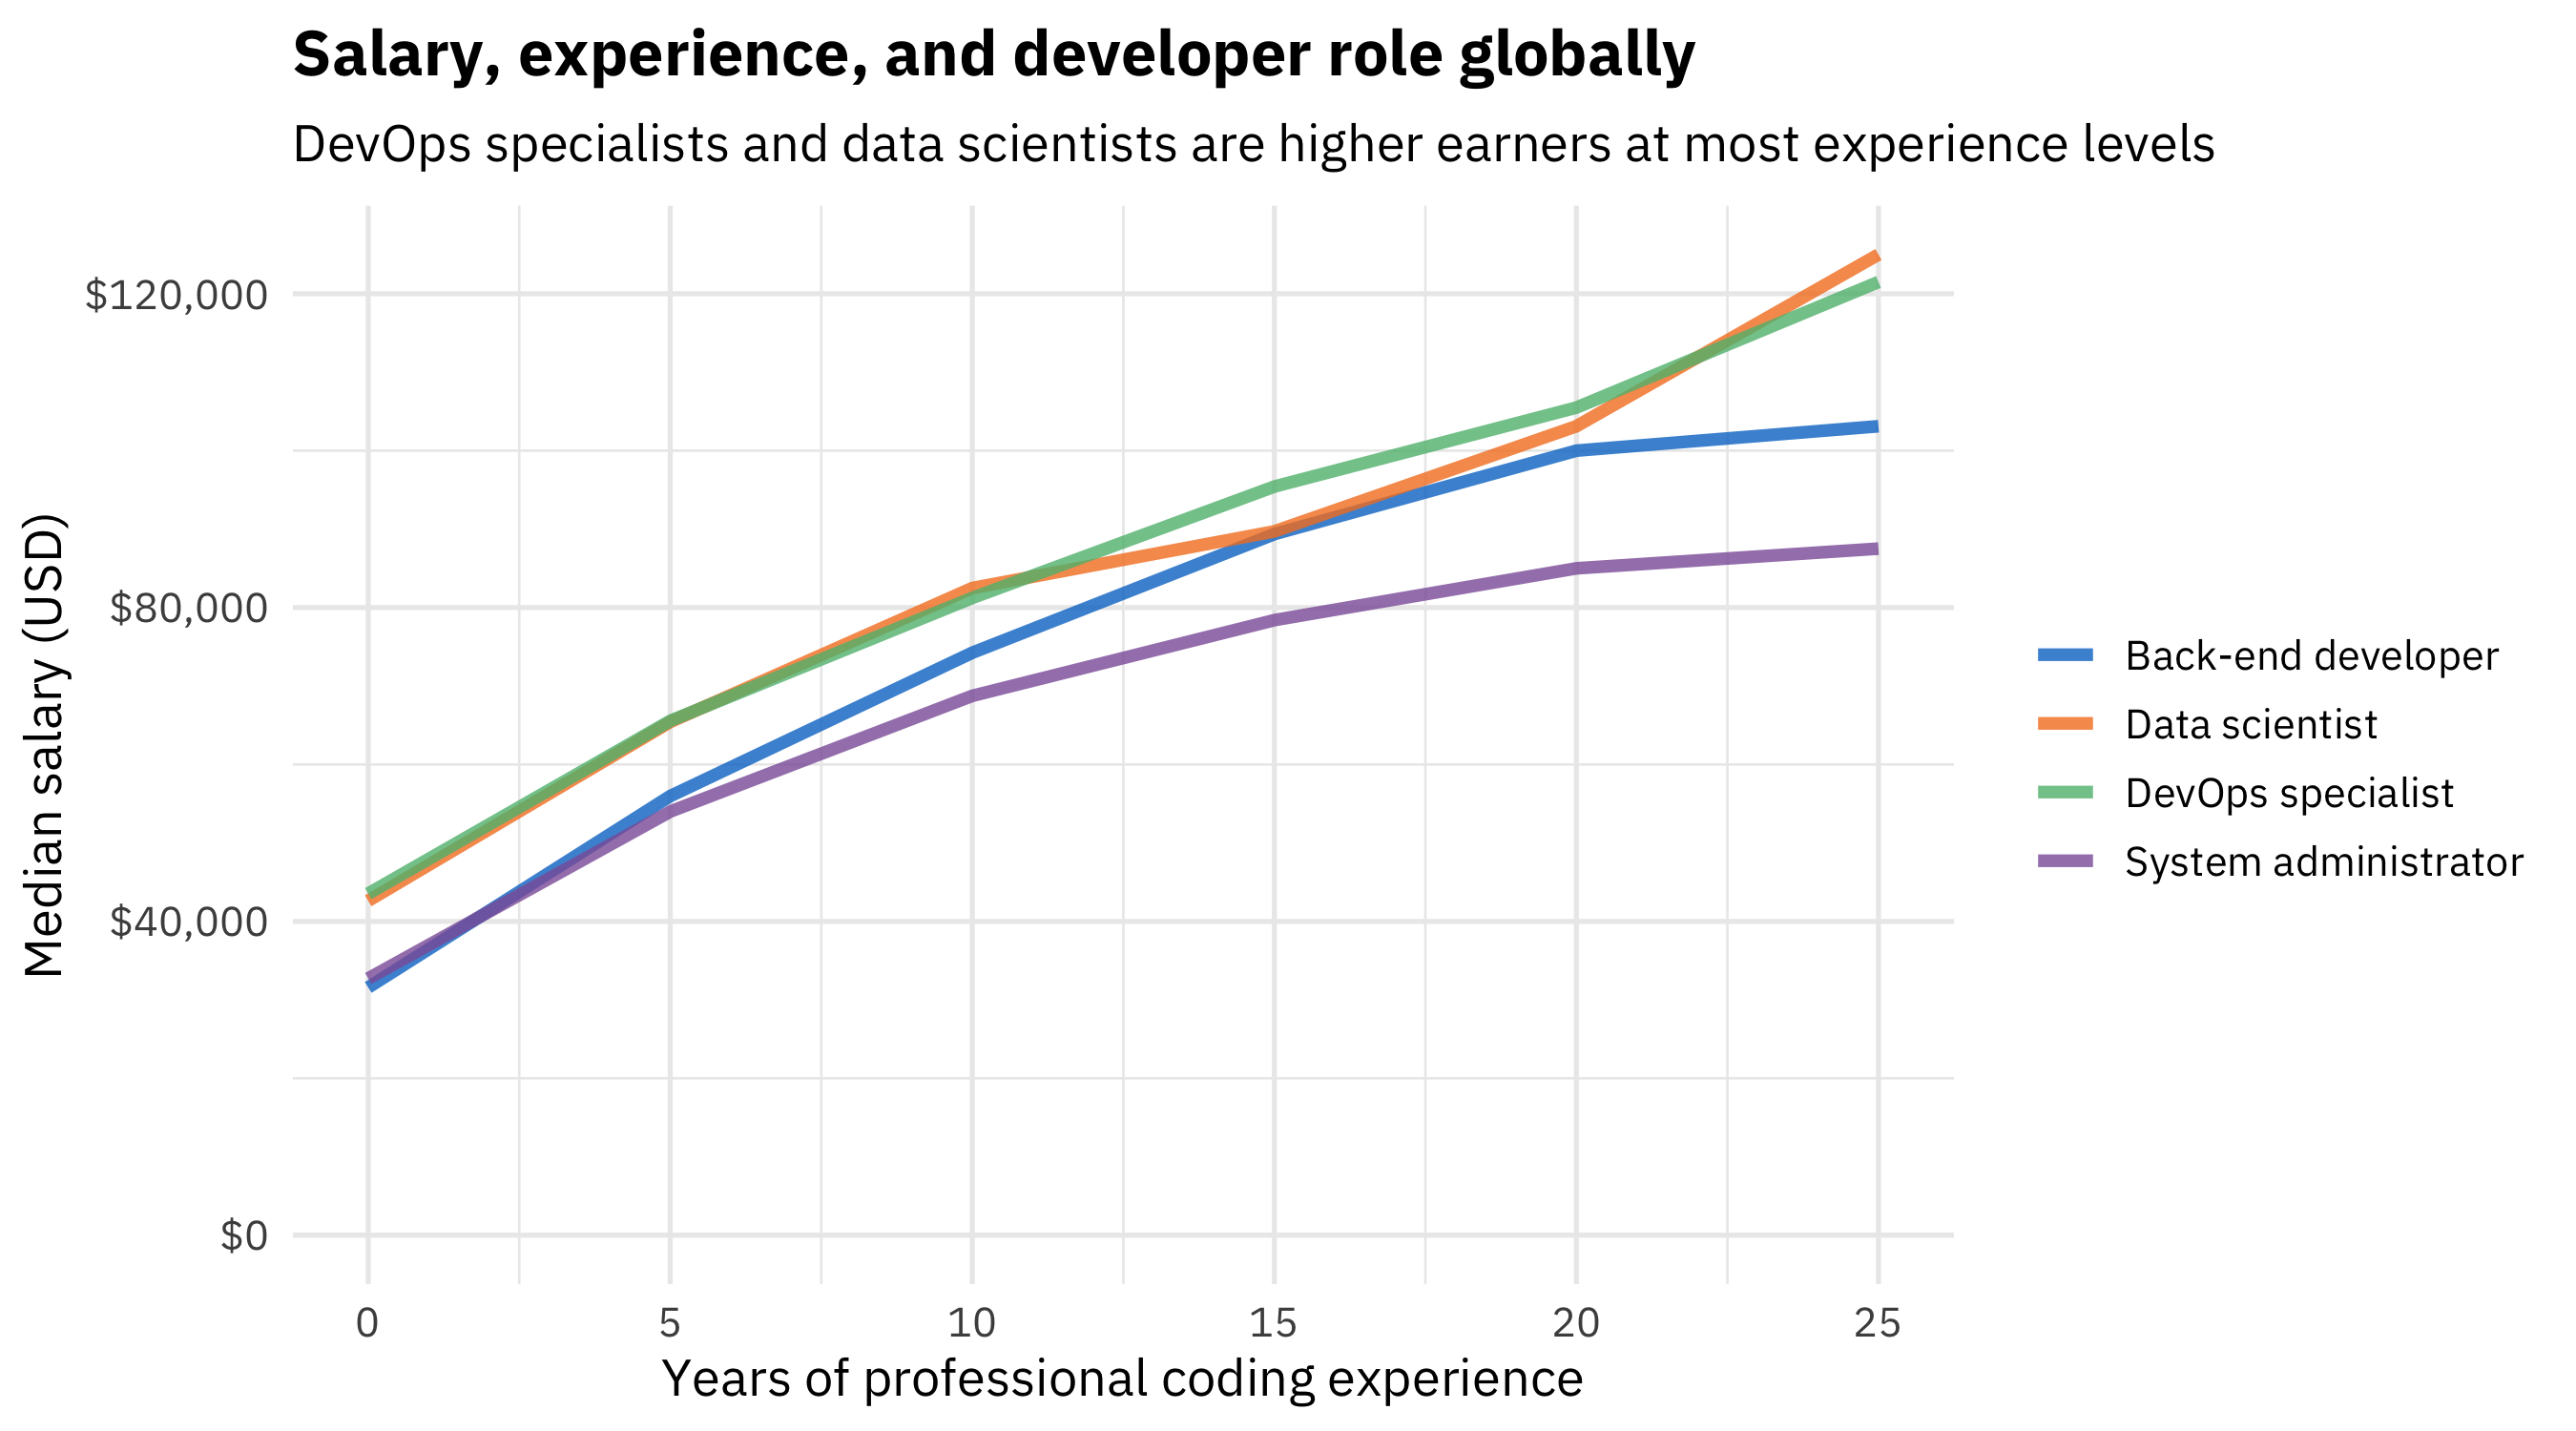
Globally, how do we we see experience, salary, and developer role interact?

enter image description here

This plot shows the global median annual salary in USD on the y-axis; check out the methodology section of the main survey report for details on how we converted local currencies used by respondents to USD. The x-axis shows years that respondents have been coding professionally. For this plot, I chose four developer roles to highlight from across the industry, although we do have this data for many other roles from designers to mobile developers.

What are some things we can notice from this plot?

  • As expected, more experienced people who code earn more, across the board.
  • Salary typically is increasing fastest for early-career developers.
  • Folks who work in data and DevOps are high earners, not only in absolute terms, but also at a given experience level.
  • Data science and DevOps roles are somewhat newer, at least framed in those ways with those titles, but we see that some of the people in those roles have been coding for a long, long time. These folks earn a lot.
  • The relative shift in salary from early to mature career stage for back-end developers compared to system administrators is interesting, and I would love to know how this develops moving forward.

It's important to remember when looking at a plot like this that we are seeing it today; it's a bit more like looking into the past than looking into the future, in terms of salary trends.

What are your thoughts? This analysis uses survey data that will be publicly available under the Open Database License soon, so you can reproduce this for yourself if you like, or dig into further details. In the meantime, you can check out our previous years' results. Do you have topic ideas for future data science explorations?
31
  • 51
    Are there any plans to bring a social scientist or survey methodologist on board to help with the design of the 2020 survey? The data science aspect of the survey is neat, but practically speaking it's of limited value to the broader research community - who would love to get their hands on a large sample like this! - due to some methodological issues with the design.
    – rjzii
    Commented Apr 10, 2019 at 16:05
  • 21
    @rjzii We do have folks with training and experience in those areas already on board, including me. We are committed to improving the survey and absolutely open to specific feedback about survey design, though! We're always interested in best practices in survey methods for opt-in non-probability surveys, observational studies, etc.
    – Julia Silge StaffMod
    Commented Apr 10, 2019 at 17:03
  • 24
    It's good to hear that there are members of the team that have some background is survey methods! Speaking as a peer reviewer (my PhD training is in the field of in computational social science, which included survey methods), I noticed a lot of issues with the construction of the survey instrument when I took it. Last year was also problematic since you should not change the instrument after you start collecting data either. There's also been some questions about terminology (e.g., professional developer) which can result in errors.
    – rjzii
    Commented Apr 10, 2019 at 17:17
  • 10
    Going back to the "professional developer" again real quick though, I don't recall seeing it defined on the instrument and it doesn't seem to be on the insights page. That really needs to be done since it is important to interpreting the data and there is a cultural component to what that means. Misinterpretation of that by respondents could really skew the interpenetration and should have come up during the pretest and pilot phase of instrument development.
    – rjzii
    Commented Apr 10, 2019 at 17:29
  • 6
    That particular question did not surface as a problem when we tested the survey during UX research sessions or when we piloted the survey with 1000+ respondents before its broader fielding. I added the actual wording from the instrument to the other question, to clarify: meta.stackoverflow.com/a/382725/5468471
    – Julia Silge StaffMod
    Commented Apr 10, 2019 at 17:35
  • 7
    We've only written about this very generally, but also talk about currencies and other geographical issues here. If you have a specific question, I'm happy to answer it.
    – Julia Silge StaffMod
    Commented Apr 10, 2019 at 18:15
  • 47
    I wish $120,000 per month was a reasonable salary expectation for someone doing my job... Commented Apr 11, 2019 at 9:03
  • 7
    "Do you have topic ideas for future data science explorations?". While I agree the subject of this post is pertinent (using data from the annual survey wish was just published) I also want to ask when will there be a post with a topic chosen by the community? So far, it seems 'closing questions' (and its derivatives) is a winner, isn't it? Thank you. Commented Apr 11, 2019 at 16:59
  • 4
    Could you please do such a graph per programming language, not just developer type? I know the survey results page has something similar, but unfortunately it's just a point plot of the average experience vs average salary.
    – Bergi
    Commented Apr 11, 2019 at 17:49
  • 15
    How do you actually convert salaries? Maybe it's just me, but I don't see where in the methodology you explain how you convert salaries from outside the US to match those in the US. I mean, I'm from Uruguay, and I could answer the survey saying I have a high salary of USD40.000 per year, and that would look like a student in your graph. That's what I understand at least, I can ask a separate question if it's needed Commented Apr 11, 2019 at 23:00
  • 34
    I think @CamiloTerevinto is right; there must have been either adjustment for purchasing power, or a relatively low number of respondents from countries with lower costs of living, so that the median is mainly driven by high-cost countries. Aggregating salary in dollars across countries doesn't make a whole lot of sense due to varying costs of living, taxation, health care systems, etc., when most people want to see how they stack up within their own country and line of work.
    – C8H10N4O2
    Commented Apr 12, 2019 at 12:42
  • 40
    @C8H10N4O2 Concur. Even within the United States the salaries are kind of meaningless. Someone in the Midwest making $100k is going to be a lot better off than someone in Silicon Valley making the same. However, such adjustments are difficult to do unless you rely upon data sets that someone else builds out that contain the relevant adjustments.
    – rjzii
    Commented Apr 12, 2019 at 18:31
  • 6
    This analysis would be more accurate if it was normalized by the PPP or any other index that reflects the real value instead of the nominal.
    – Braiam
    Commented Apr 17, 2019 at 17:44
  • 6
    Curious that you have back end, but no full stack, ui or other designation? Why these 4 specific silos? Are they the most highly represented? Can they be broken down further?
    – The Coder
    Commented Apr 23, 2019 at 1:44
  • 3
    In South Africa your average starting salary is around $15000 for whichever role. This survey just made me depressed. I guess this is what global companies mean by saying: 'That salaries around here are very competitive'.
    – IskandarG
    Commented Apr 25, 2019 at 15:25

0

You must log in to answer this question.

Browse other questions tagged .