33

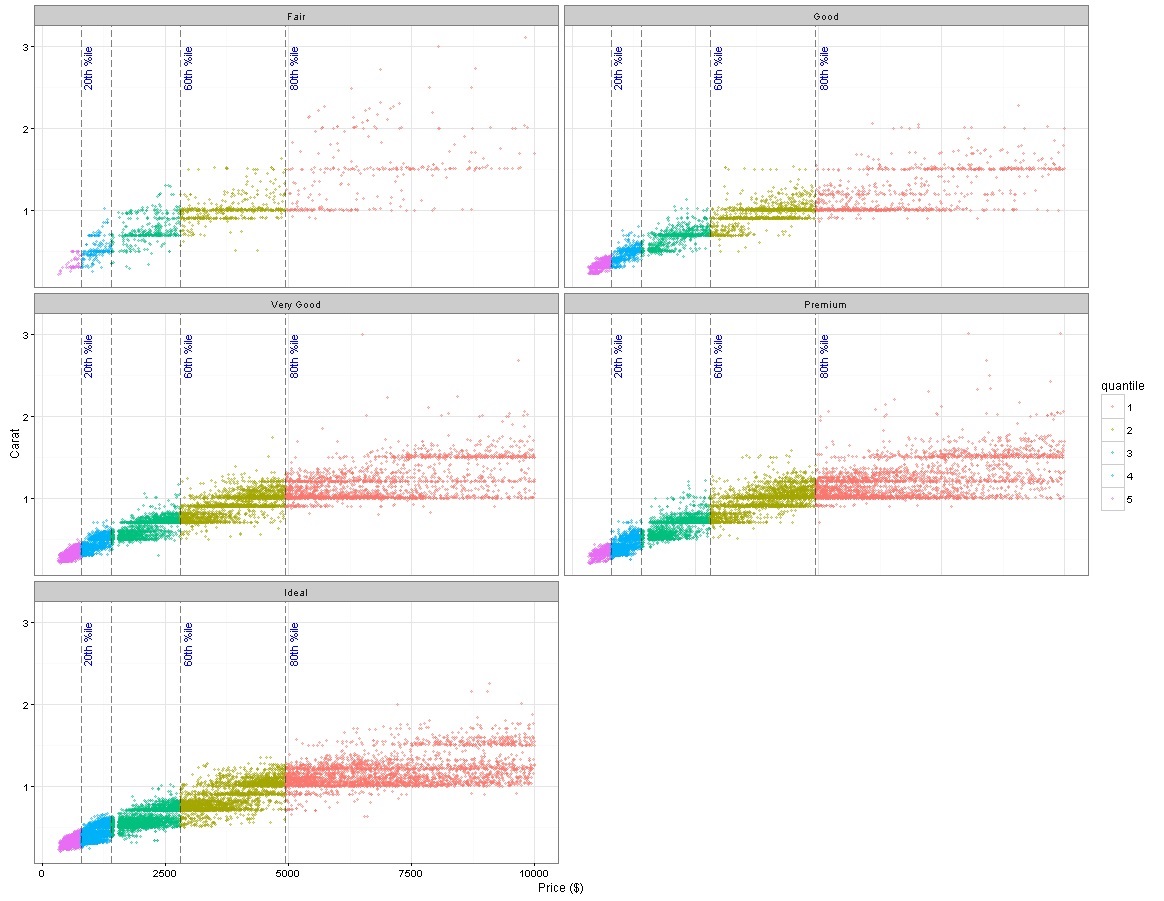
In my questions about ggplot2, I have to upload the plots.

In order to do so, I copy the plot to Paint and save it as JPEG (I tried to save the plots as PNG, but the size was large, and I couldn't upload it).

Although I can see the plot clearly on my PC, the quality is reduced after uploading it, and I can't see it as clearly anymore as shown below.

Enter image description here

I would appreciate any suggestions on how to upload the plot with high quality to be seen clearly without increasing its size.
5
  • 7
    A 24-bit PNG of this is only 500kB, an 8-bit PNG is smaller than the JPEG, so it must have been something other than file size that was keeping you from uploading the PNG. Commented Jan 18, 2016 at 16:32
  • 5
    Would it be possible to generate an SVG of the plot? If so, you should be able to use a stack snippet to display it (provided it isn't ridiculously huge).
    – cimmanon
    Commented Jan 18, 2016 at 16:51
  • 6
    That's not one plot, that's five. Save as high quality PNG, split it, then add all images.
    – user1228
    Commented Jan 18, 2016 at 17:18
  • Maybe worth trying to copy to clipboard with the right size before pasting in Paint - then save as PNG.
    – assylias
    Commented Jan 19, 2016 at 10:03
  • rstudio allows easy export of R plots. Just click export > save as image. The default format is png.
    – scoa
    Commented Jan 19, 2016 at 19:53

5 Answers 5

56

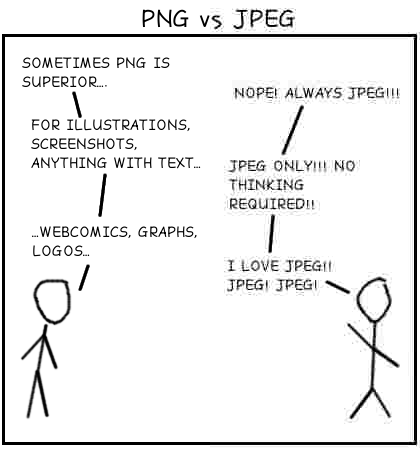
JPEG is notorious for compression like this:

enter image description here

(image from the link above)

Since JPEG encourages compression like this, the uploader takes advantage of it.

I'd recommend splitting the plots up into individual PNG images (one plot per image, instead of five per image) and adding those to your post.

I'd recommend not using another image hosting provider - some providers have been known to replace low-traffic images with advertisements to save hard drive space. Because Stack Exchange is directly involved, i.stack.imgur is the most stable thing we have.

4
  • 10
    As an addition to your answer (as your are obviously not an R user), the ggplot2 package has a built it function to do just this called ggsave, so one can easily save his plot in a png (or pdf) format by something like qplot(length, data = movies, geom = "histogram") ; ggsave("length-hist.png"). This function also allows you to set height, width, scale and the dpi. Commented Jan 19, 2016 at 10:20
  • 1
    Edited to point to the original source, thanks @Air
    – Undo Mod
    Commented Jan 19, 2016 at 16:46
  • That's one plot with panels, not several plots. OP should not split it.
    – Roland
    Commented Jul 15, 2019 at 9:23
  • JPEG artefacts are only part of the story, though important. Most of the blurriness seems to come from the scaling done by the browser to fit in in the question/answer viewport.
    – James
    Commented Jul 15, 2019 at 13:38
6

If you want to keep the plots in a single PNG, there are many online PNG compression tools (e.g. Compressor.io) as well as desktop applications (e.g. PngOptimizer) that can help decrease the size of your PNGs so that you can upload them via the built-in uploader. You won't lose image quality using these tools, but the file size can drop drastically.

1
  • 2
    Keep in mind that some of the compression settings on some of these tools can cause compression to take a long time, so start with the default settings.
    – Pimgd
    Commented Jan 18, 2016 at 16:14
3

My recommendation would be to start by using something other than Paint to save the images - another software that lets you set the compression level.

As said in other comments, uploading five separate images would be a good idea.

Firstly some generic advice:

But the issue here isn't the just the format - it's the compression ratio that's the issue. Try downloading some free image software like the GNU Image Manipulation Program.

saving the file as Jpeg from such software will allow you to alter the compression level - JPEG specifically does have a "lossless/near lossless" compression level - perfect for detailed images such as those you are presenting, SO might (I say might respect that compression). Also, when saving as PNG from GIMP you can again, specify compression levels - thus making smaller PNG files (though possibly lossy).

Reccomendation - GIF:

That said, you may find using the GIF format worth trying (it is pretty much designed for these kind of images), GIMP also allows for export in GIF format - It has exceptional compression ratio for a lossless image type.

Note that it is a common misconception that GIF image's are purely for animation - the formats original application was for graphs, diagrams, drawings. IE: exactly what you want

0

Other option you have, in case you want to "upload" the image is to embed a link to a generated SVG of your plot.

Pros:

  • There will be no quality loss at all.
  • You won't have to worry about the size limit of your image, as it will be hosted outside SO (e.g. http://imgh.us)

Cons:

If you decide this suits your needs,

Wrap your R code with:

svg("normal_distribution.svg",width=7,height=7)
... R code ...
dev.off()

For example,

svg("normal_distribution.svg",width=7,height=7)
s <- seq(10, 9234500, by=runif(1, 4, 199))
y <- rnorm(s)
hist(y, prob=T, col=c('cornflowerblue'), border = F)
curve(dnorm(x, mean=mean(y), sd=sd(y)), add=T, col=c('black'))
dev.off()

Then upload the generated normal_distribution.svg file to for example,imgh.us

Finally when the file is updated and you have the link, add this html to your SO post:

<img src="https://imgh.us/normal_distribution_1.svg"/>

You are done, edit this post to see the code.

Link to the image here

5
  • 3
    It is true that a vector format is preferable for this type of plots. Unfortunately, the OP is trying to display the images in the post, and not only link to a file, so he is limited in the formats he can use by the browsers.
    – user000001
    Commented Jan 18, 2016 at 16:35
  • 5
    I don't see much point in using vectors for a plot that consists mainly of scattered single pixels. Commented Jan 18, 2016 at 16:42
  • 3
    Your final two paragraphs are dead wrong. PNG is specifically a Rasterized format which uses Lossless compression, and BMP is also lossless (because it does no compression). A vector format does have the advantage that is can be scaled arbitrarily (which may be what you were thinking of), and for many images it will be more compact. However, looking at these plots, I would be surprised if a vector format was smaller than PNG. Commented Jan 19, 2016 at 8:08
  • The goal is to display the images inline. These sites don't support displaying PDFs inline. Commented Jan 19, 2016 at 8:30
  • 1
    Why not use a stack snippet with the SVG? That way it can be hosted on-site.
    – Pokechu22
    Commented Jan 19, 2016 at 18:57
0

Others have noted the inadequacy of JPEG for graphs and charts, with PNG the superior format, and there are a number of ways to get your ouput in that format (even in Paint). These questions are better suited to the main site though.

However, what is important to note is that once you upload the image, it needs to fit into the question and answer part of the page. This scales with the available device size or window but is at most 675 pixels wide. If your image is wider, the browser will scale it. Different browsers may perform better than others. The scaling usually works best when it is an integer multiple (eg 2x, 3x, etc).

You can either produce it in a size which can be scaled more easily by the browser, or rescale the image yoursef to match the site requirements using a decent image editing program (eg GIMP) to avoid browser scaling.

You must log in to answer this question.

Not the answer you're looking for? Browse other questions tagged .