Improvement efforts on Stack Overflow slowed way down, leaving junk on the site. Many Stack Overflow review queue lengths increased.
Review Queues and Flags
As I originally wrote this, I didn't have any hard figures about what the queue lengths were before the strike, but I noticed that while some queues have about the same length, some got bigger.
Tracking weekly since Tue. June 13, 2023:
| Date |
1st Q |
Close V. |
Late Ans. |
1st Ans. |
Triage |
Sugg. Ed. |
Reopen |
LQA |
| June 13 |
6,274 |
2,716 |
2,017 |
727 |
496 |
495 |
441 |
310 |
| June 20 |
7,044 |
2,745 |
2,319 |
1,296 |
497 |
440 |
364 |
534 |
| June 27 |
6,588 |
2,730 |
2,380 |
1,698 |
496 |
437 |
402 |
782 |
| July 4 |
5,940 |
2,442 |
2,271 |
1,646 |
472 |
496 |
480 |
1,110 |
| July 11 |
6,660 |
2,757 |
2,130 |
2,101 |
500 |
486 |
505 |
1,274 |
| July 18 |
6,168 |
2,755 |
2,252 |
2,451 |
500 |
480 |
499 |
1,365 |
| July 25 |
5,440 |
2,845 |
2,323 |
2,927 |
490 |
489 |
486 |
1,545 |
| Aug. 1 |
5,318 |
2,537 |
2,545 |
2,947 |
499 |
490 |
544 |
1,648 |
| Aug. 8 |
5,084 |
2,734 |
1,971 |
2,510 |
487 |
490 |
459 |
857 |
| Aug. 15 |
4,383 |
2,171 |
2,166 |
1,905 |
491 |
496 |
306 |
321 |
| Aug. 22 |
3,793 |
2,461 |
1,958 |
1,794 |
494 |
494 |
317 |
111 |
| Aug. 29 |
3,736 |
2,371 |
1,552 |
1,661 |
459 |
442 |
215 |
162 |
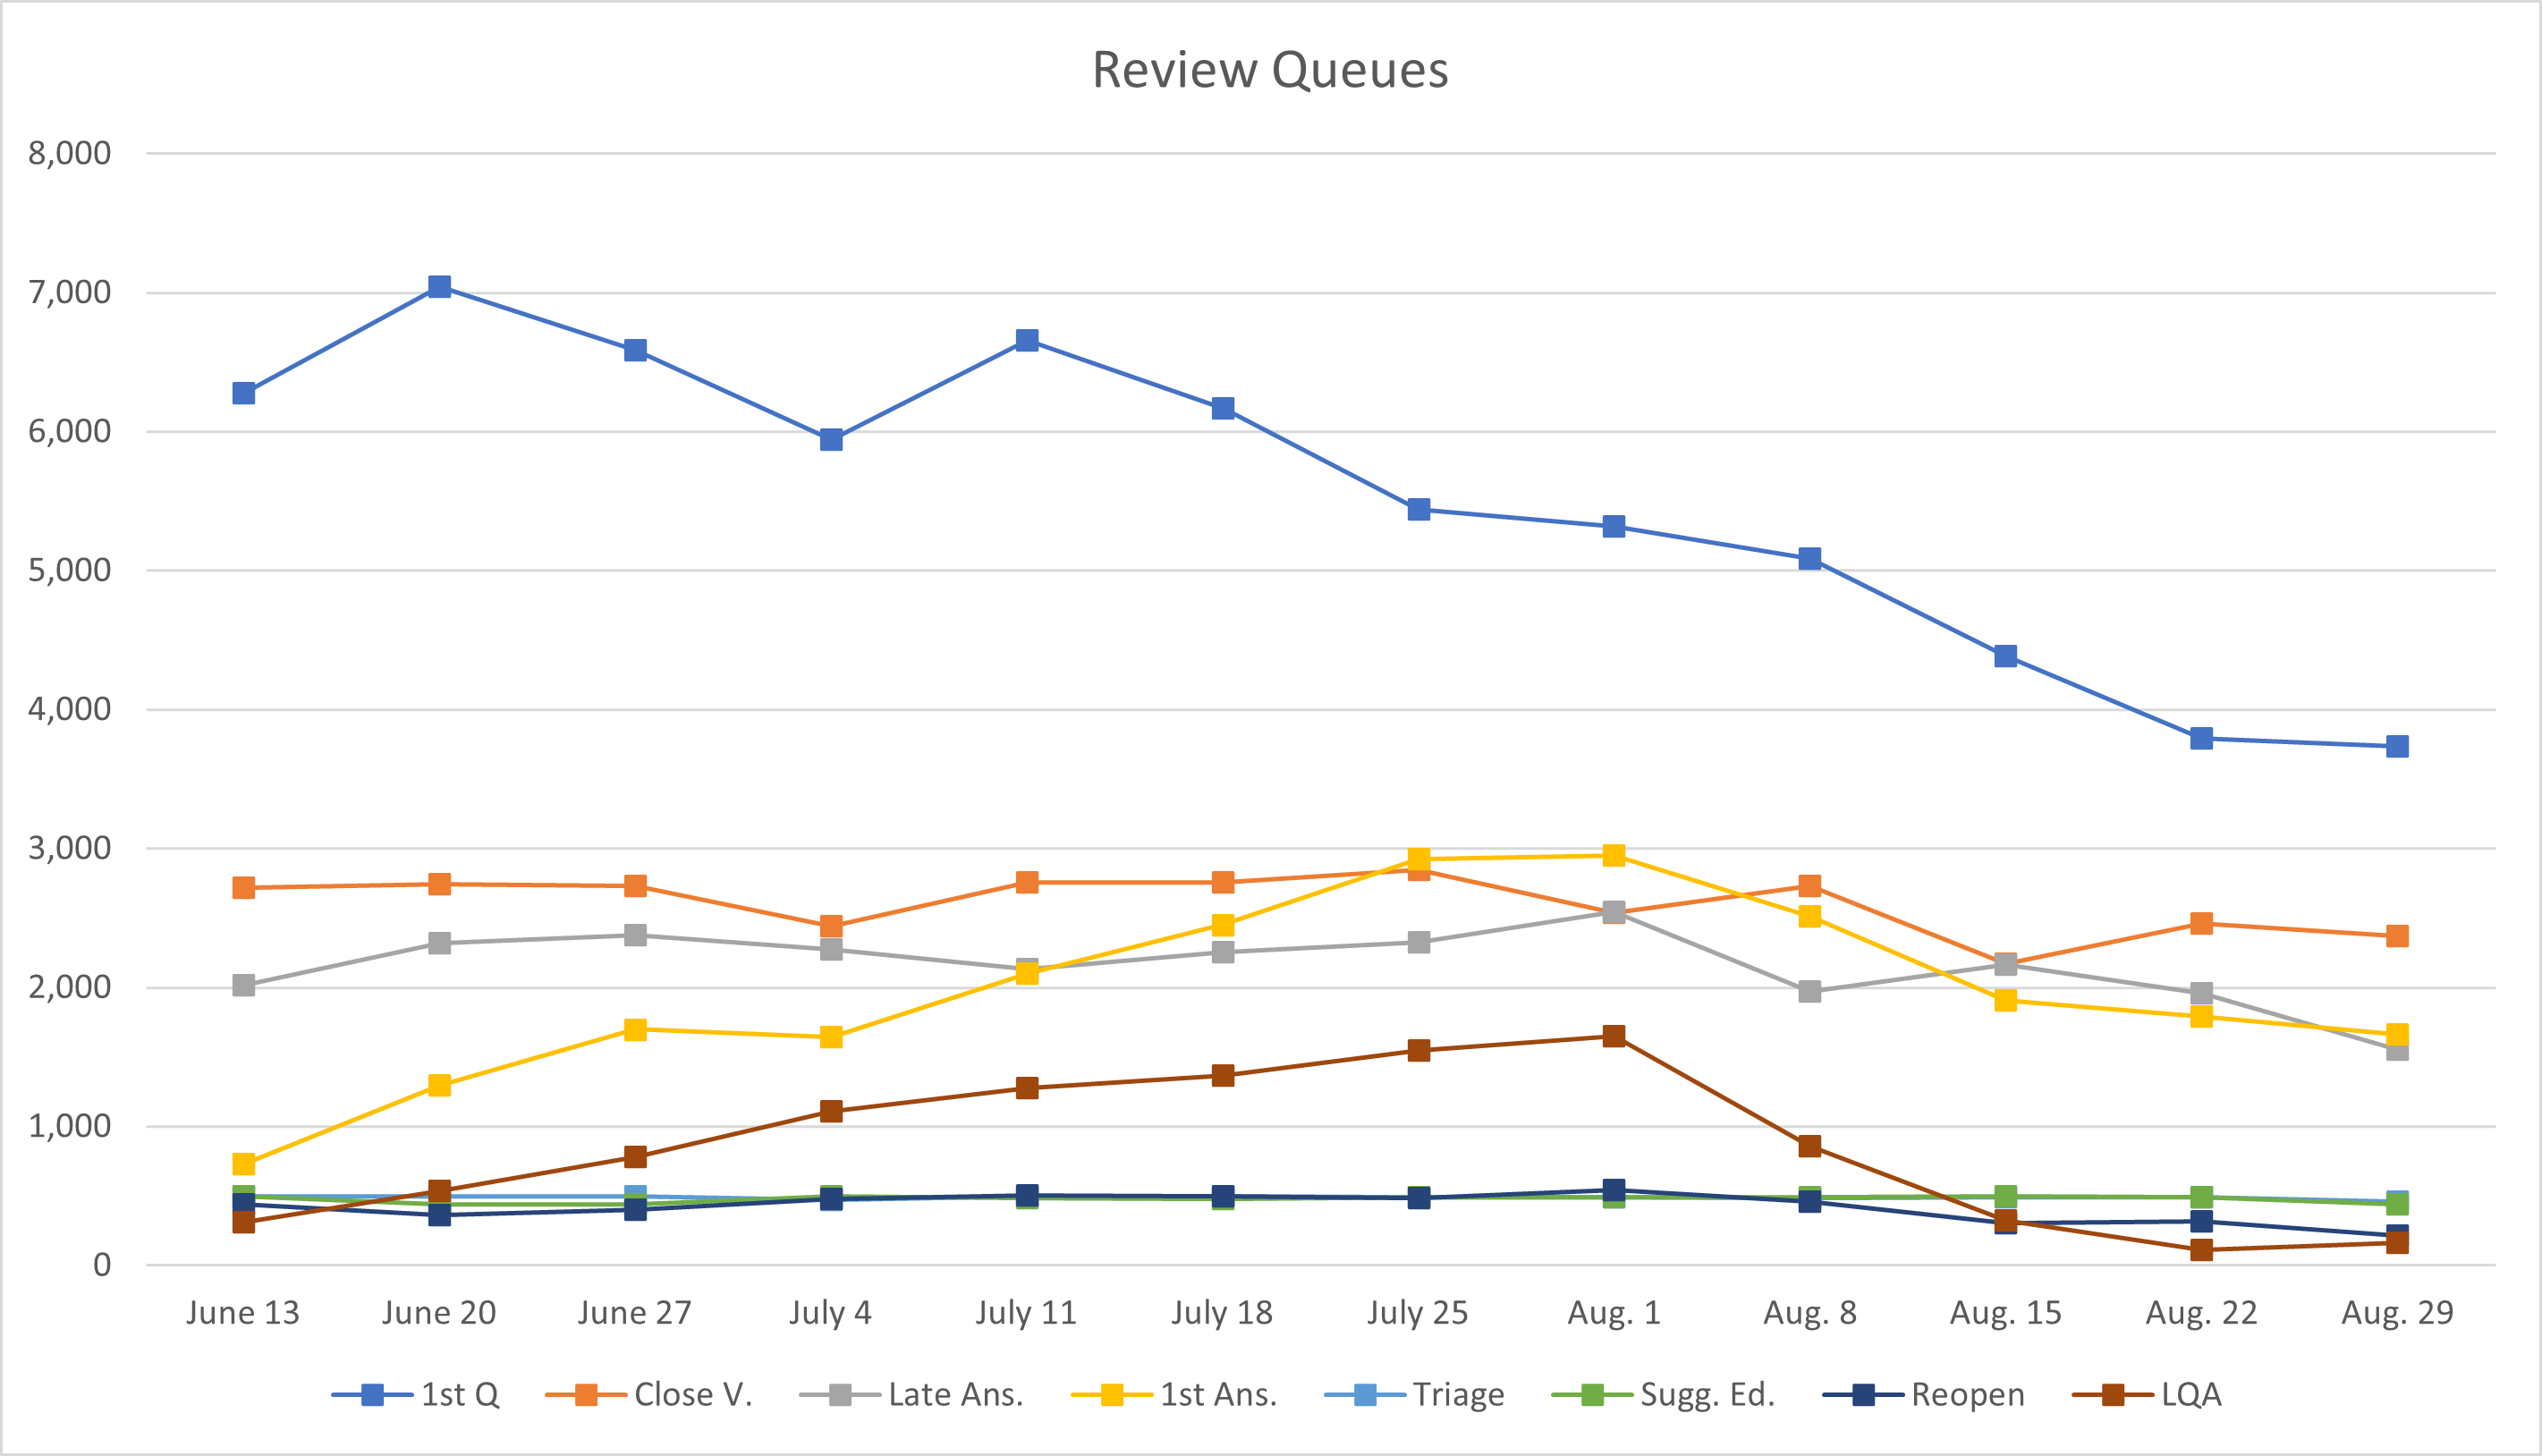
Triage and Suggested Edits are capped at 500a, so they haven't changed much.
But I noticed reopen votes rising, and one where I had contributed recently, Low Quality Answers, was up a lot. Low Quality Answers used to hang around 100-150, sometimes dipping into the double digits. I saw it as low as 17 a couple weeks before the strike.
The obvious implication is that if review time per item is held steady, average time for resolution increased, including flags associated with the review queues. On Close Votes, votes are more likely to age away, so fewer posts on Stack Overflow that should get closed were getting closed, resulting in more junk visible on the site.
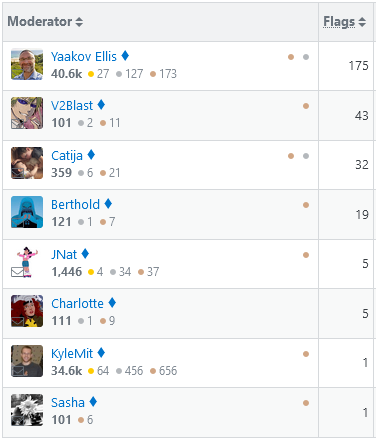
I would imagined that flags piled up, and Zoe's comment seems to back up that conjecture. Problems weren't being remediated.
The site quality went down during the strike.
Tag Cleanup
The connect tag was in the middle of being burninated. When I started contributing to that effort a few weeks ago, the tag was still on over 2,200 questions. A few weeks later, the count got down below 1,100. But since the strike started and that post was no longer featured, the count has hardly budged. One June 13, it was on 1,040 questions. There are now 4 questions since July 7 that still have this tag. Tag cleanups slowed way down.
| Date |
Number of Questions with [connect] |
| June 13 |
1,040 |
| June 20 |
1,012 |
| June 27 |
1,011 |
| July 4 |
1,002 |
| July 11 |
995 |
| July 18 |
985 |
| July 25 |
969 |
| Aug. 1 |
962 |
| Aug. 8 |
957 |
| Aug. 15 |
935 |
| Aug. 22 |
896 |
| Aug. 29 |
803 |
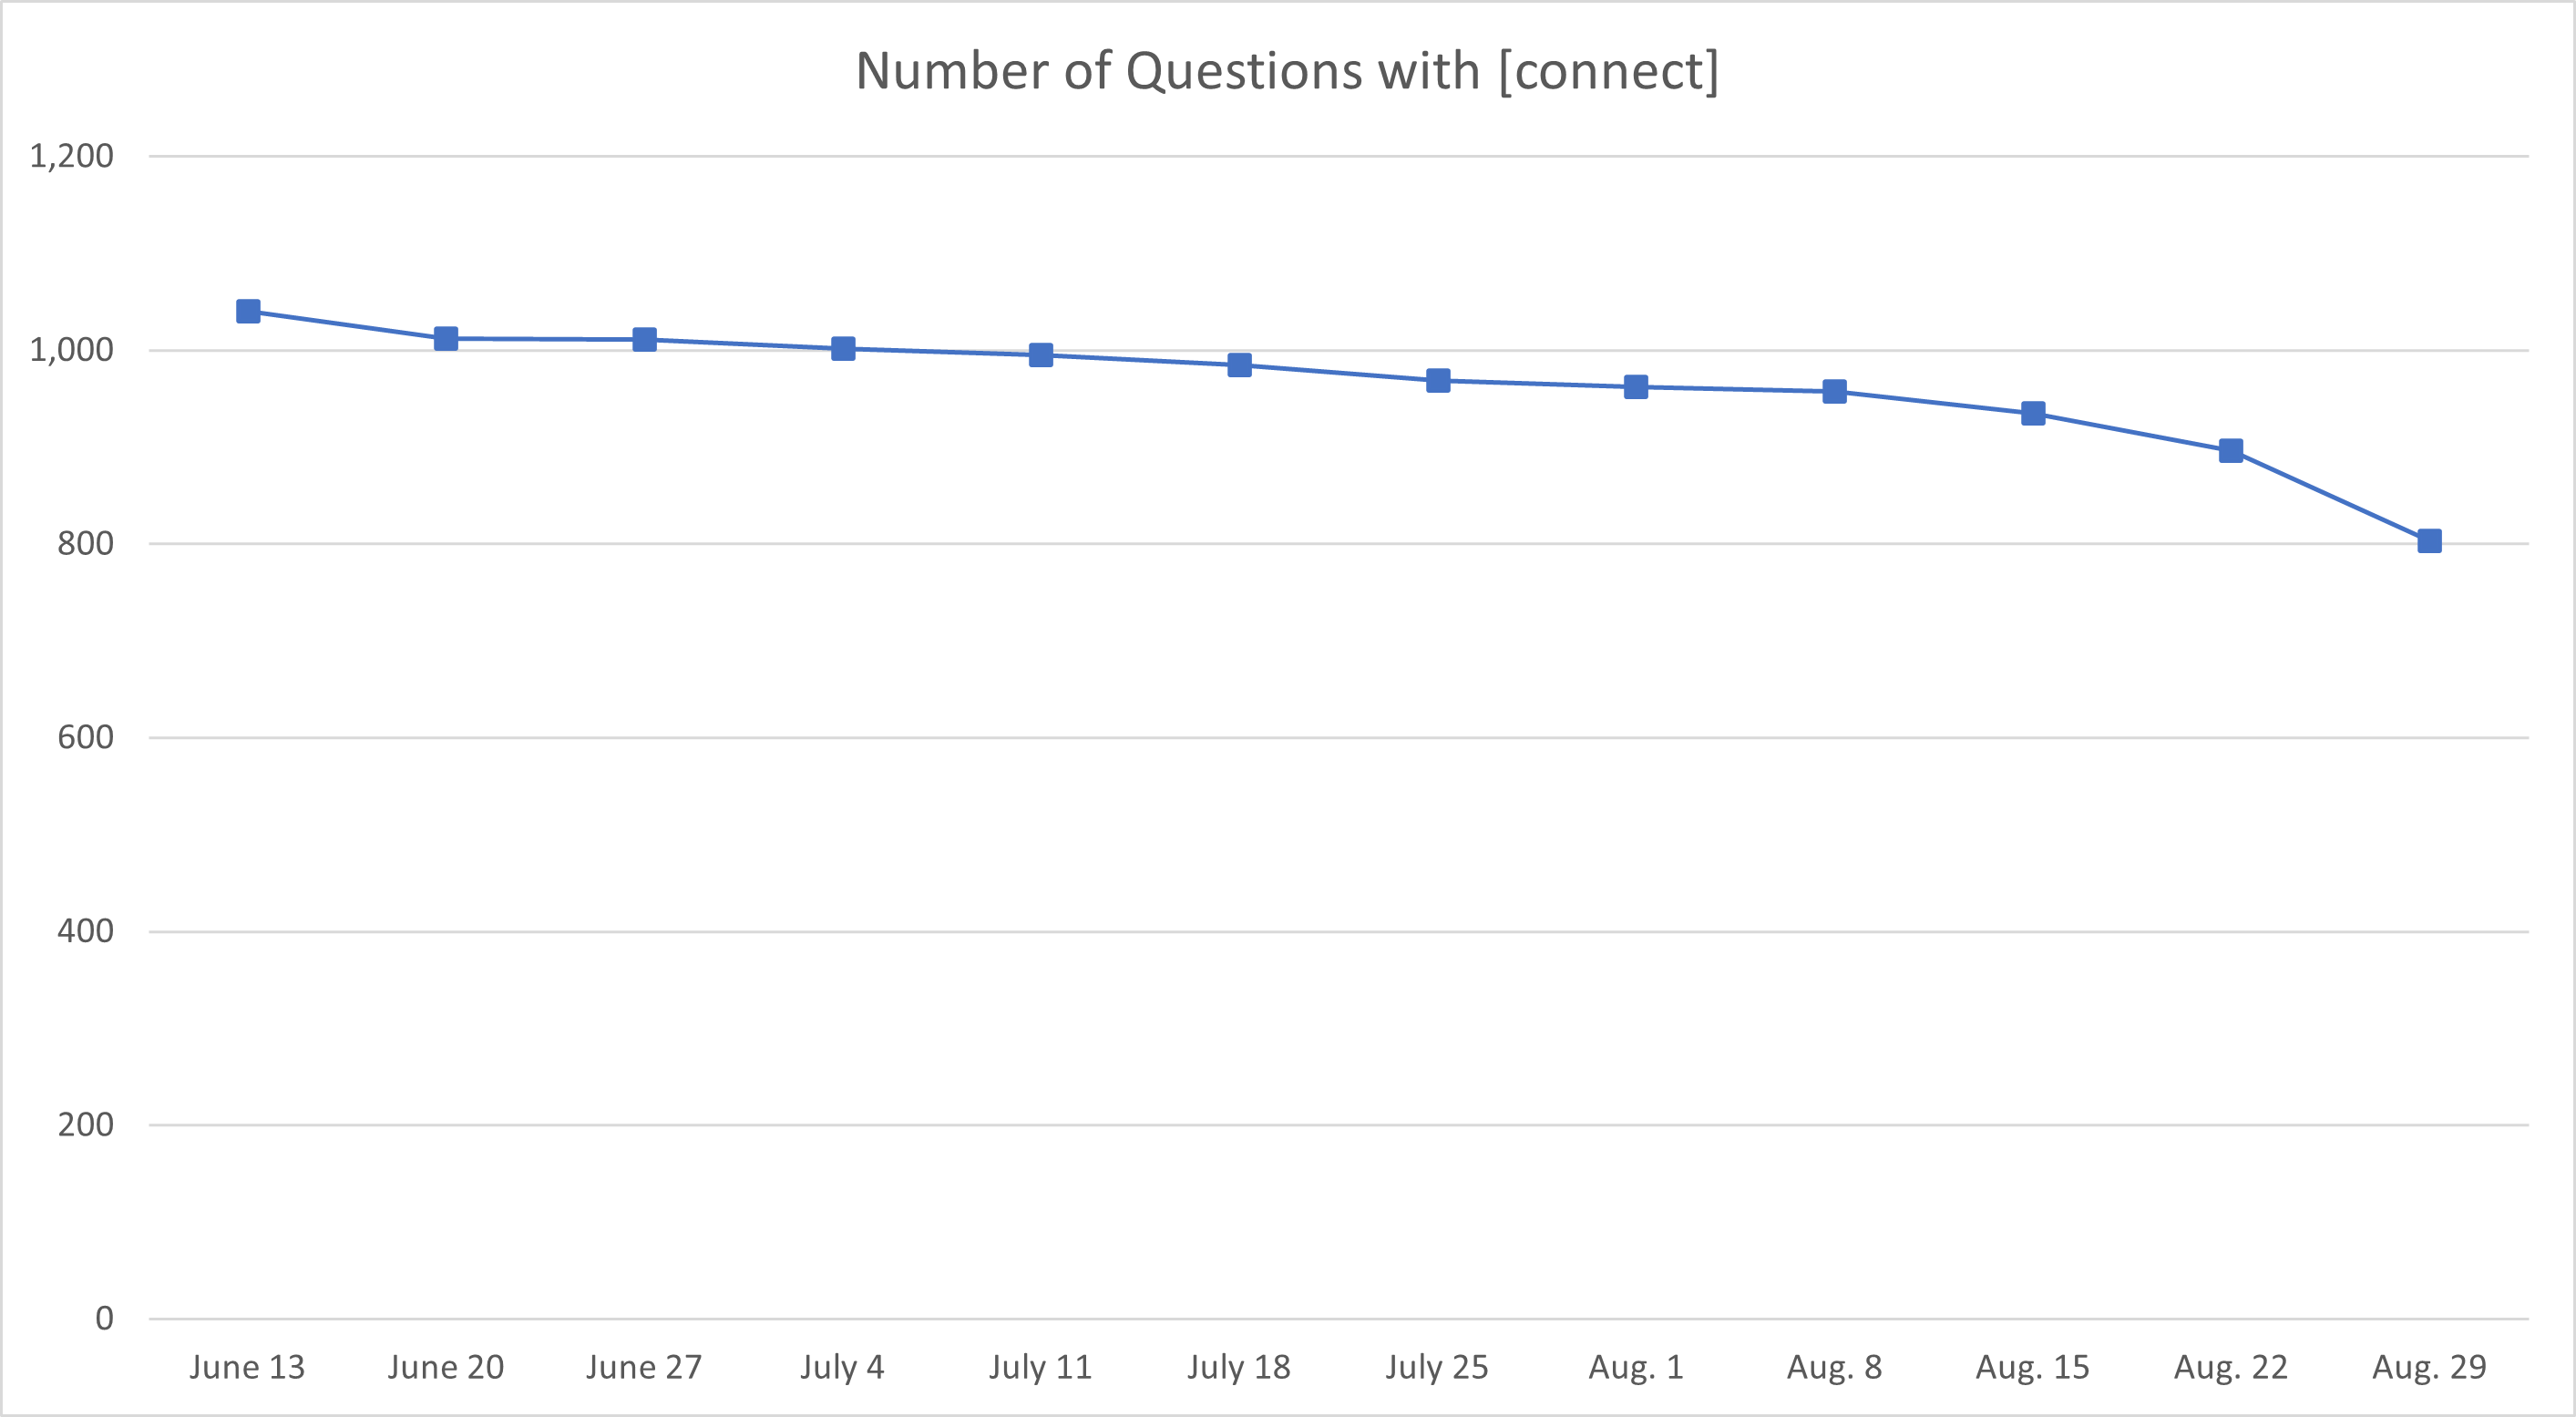
For a Web 2.0 product such as Stack Overflow, if tags are applied incorrectly, and not cleaned up, then the information is not organized as well, making useful answers harder to find.
The site quality went down.
Was Stack Overflow Broken?
I don't normally search out spam to flag and destroy it, but one day I saw a few commonly posted spam posts yesterday, about a topic that most certainly does not belong here. I flagged them at the time, and they disappeared soon after, but not as quickly as it usually disappears.
More spam posts lasted longer, more flags piled up, and many review queues piled up as well. While they got quite large, the flag queues and review queues didn't overflow. Was Stack Overflow brokenb? I don't think it was broken, but it was quite a bit worse than it should have been.

aI haven't seen Triage go above 500, but I didn't find the reference for when it was increased to 500, just when it was a long time ago increased to 200.
bI had that mug for years, probably ever since I hit 100k on Stack Overflow. I accidentally knocked it over recently, and this was the unfortunate result.

