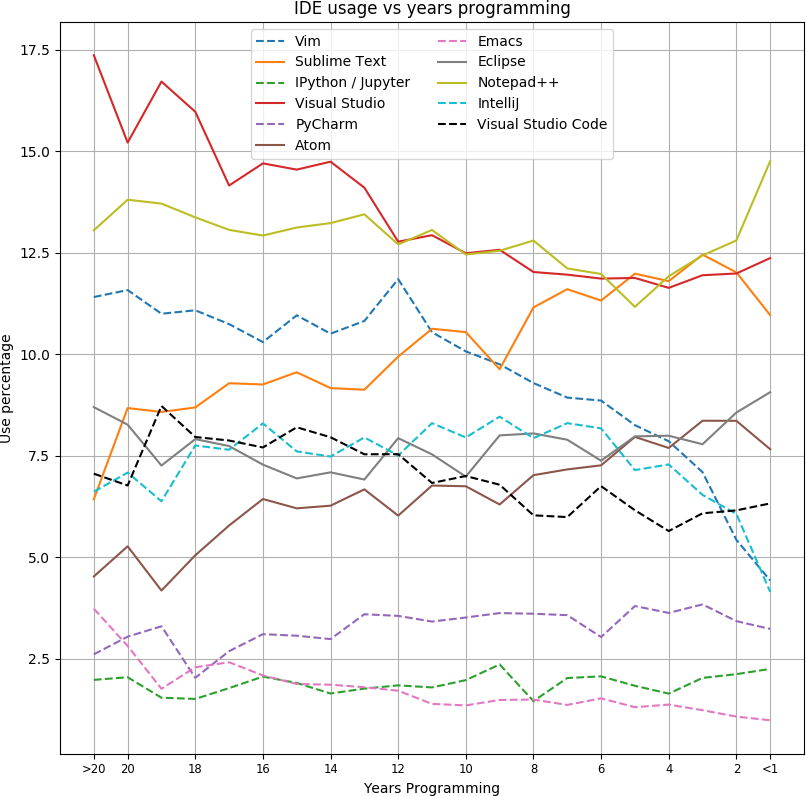
It's a fun graph, but I think it's important to remember that we can only make guesses from this data.
One of the main problems with surveys:
Self-Selection Bias - In statistics, self-selection bias arises in any situation in which individuals select themselves into a group, causing a biased sample with non-probability sampling.
We have no idea how many people decided NOT to take the survey. It could be those users who decided not to participate were also young scrappy VIM users with a strong distaste for surveys.
That's not to say that this data, or picking patterns out of graphs has no place. It very much has a place. That place however is not at the end of the story, it's at the beginning. It's not the answer. To put it another way, we use these techniques to develop hypothesis, not to answer them.
See also
Texas SharpShooter Fallacy:
Texas sharpshooter fallacy is an informal fallacy which is committed when differences in data are ignored, but similarities are stressed. From this reasoning, a false conclusion is inferred. This fallacy is the philosophical/rhetorical application of the multiple comparisons problem (in statistics) and apophenia (in cognitive psychology). It is related to the clustering illusion, which refers to the tendency in human cognition to interpret patterns where none actually exist.
The name comes from a joke about a Texan who fires some gunshots at the side of a barn, then paints a target centered on the tightest cluster of hits and claims to be a sharpshooter.
Example:
A Swedish study in 1992 tried to determine whether power lines caused some kind of poor health effects. The researchers surveyed everyone living within 300 meters of high-voltage power lines over a 25-year period and looked for statistically significant increases in rates of over 800 ailments. The study found that the incidence of childhood leukemia was four times higher among those who lived closest to the power lines, and it spurred calls to action by the Swedish government. The problem with the conclusion, however, was that the number of potential ailments, i.e. over 800, was so large that it created a high probability that at least one ailment would exhibit the appearance of a statistically significant difference by chance alone; ie. the multiple comparisons problem. Subsequent studies failed to show any links between power lines and childhood leukemia, neither in causation nor even in correlation.
Data Dredging:
Data dredging (also data fishing, data snooping, and p-hacking) is the use of data mining to uncover patterns in data that can be presented as statistically significant, without first devising a specific hypothesis as to the underlying causality.
Example
Here is a simple example. Throwing a coin five times, with a result of 2 heads and 3 tails, might lead one to hypothesize that the coin favors tails by 3/5 to 2/5. If this hypothesis is then tested on the existing data set, it is confirmed, but the confirmation is meaningless. The proper procedure would have been to form in advance a hypothesis of what the tails probability is, and then throw the coin various times to see if the hypothesis is rejected or not. If three tails and two heads are observed, another hypothesis, that the tails probability is 3/5, could be formed, but it could only be tested by a new set of coin tosses. It is important to realize that the statistical significance under the incorrect procedure is completely spurious – significance tests do not protect against data dredging.
Multiple Comparisons Problem
In statistics, the multiple comparisons, multiplicity or multiple testing problem occurs when one considers a set of statistical inferences simultaneously or infers a subset of parameters selected based on the observed values. In certain fields it is known as the look-elsewhere effect.
The more inferences are made, the more likely erroneous inferences are to occur. Several statistical techniques have been developed to prevent this from happening, allowing significance levels for single and multiple comparisons to be directly compared. These techniques generally require a stricter significance threshold for individual comparisons, so as to compensate for the number of inferences being made.
Example
Suppose we consider the efficacy of a drug in terms of the reduction of any one of a number of disease symptoms. As more symptoms are considered, it becomes increasingly likely that the drug will appear to be an improvement over existing drugs in terms of at least one symptom.

<1, anyway, I'd say this is mostly true, it's nice to see the data on it.Visual Studio Codeis counted as a separate IDE (that's how the survey handles it, not my decision) I draw the x axis inverted on purpose, so that younger programmers are to the right.