313

My name is Julia Silge and I'm a data scientist here at Stack Overflow. Recently, Tim Post suggested the idea of setting up regular, bite-size, data-focused updates for Meta: less content than a blog post, but enough to share what our energy is going to, and focused on our community work. Let's do it!

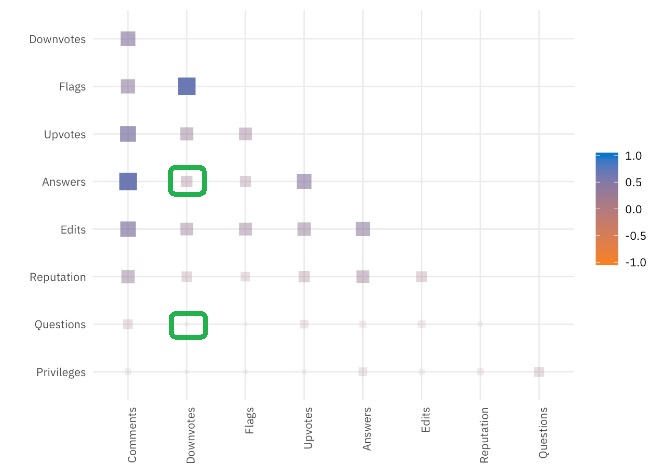
This month, let's look at one plot that is part of a big, multi-team project focused on improving how users learn about our community and its norms. This plot looks at how actions that users take are correlated.

enter image description here

This is a correlation plot. The values shown here are the Pearson correlation coefficient which can range from 1 (two values are perfectly correlated) to -1 (two values are perfectly anti-correlated). The size and color of the squares correspond to the correlation. The Privileges feature measures how many new privileges the user earned in the time period (which was a recent few months), and the Reputation feature measures user rep at the beginning of the time period. Notice a few things:

  • There is almost no orange. Users on Stack Overflow are either active doing lots of things, or not.
  • Many of the squares are very small and transparent; these correlations are near zero and there are not strong relationships either way for those.
  • The strongest relationships we see are between flags and downvotes, and between comments and answers. Users who flag a lot also tend to downvote, and users who comment also tend to write answers.
  • Users with higher reputation tend to write more answers and comments.

We can use relationships like these to understand who is using our site and in what ways, so we can build, for example, better guidance for users earning new privileges. That's this month's bite-size data science time! Thoughts? Do you have topic ideas for more data science time adventures?

66
  • 7
    How would you define a "data science time adventure"?
    – Nissa
    Commented Nov 5, 2018 at 19:35
  • 13
    @Servy I'm not sure I'd infer that the correlation is between flags & downvotes on the same content, rather that user who down vote a lot tend to also flag a lot (and vice versa), but they may be down voting and flagging different things. Although, I would bet that if we actually did look, posts that get lots of flags are also probably down voted pretty commonly.
    – joran
    Commented Nov 5, 2018 at 19:49
  • 10
    @Servy I downvote anytime I use low quality or NAA flags to put the score below 0 so that I can also vote to delete. Commented Nov 5, 2018 at 19:58
  • 37
    @JuliaSilge Can I trouble you in clarifying a couple of points? First - what are you correlating here, users or actions on posts (i.e., does the corrolation between downvotes and flags mean "users who tend to downvote also tend to flag" or does it mean "users who flag a post tend to also downvote it"). Second, the legend explains the meaning of the colors of the data points, but what is the meaning (if any) of the size of those squares?
    – Mureinik
    Commented Nov 5, 2018 at 20:00
  • 26
    I would honestly expect a moderate anti-correlation between answers and questions. Most users either ask questions or post answers, and do little to none of the "other" type of post. It's uncommon for users to do lots of both, at least anecdotally.
    – Servy
    Commented Nov 5, 2018 at 20:53
  • 34
    @JuliaSilge And yet it's just so common in practice to see people that do predominately one or the other that it almost suggests there's a methodology problem. For example, which users are included? Is this counting the millions of users with no activity at all, or the millions of users that asked one question once five years ago? What does the chart look like when you only look at users active in the past month and with more than, say, 50 reputation, or >X posts, or some other filter to remove people that did so little that statistical analysis of what they did isn't meaningful.
    – Servy
    Commented Nov 5, 2018 at 21:31
  • 6
    @Servy I also find the lack of correlation there interesting, but I also don't find it entirely implausible that there are lots of users who primarily answer, ask or do both in equal numbers, to the extent that across all users, there is little correlation. There could be large numbers of people who specialize, but across all users, enough people do different things that there is little correlation. That doesn't mean that those subgroups aren't interesting, of course.
    – joran
    Commented Nov 5, 2018 at 21:44
  • 13
    @joran The number of people who post lots of both questions and answers would need to outnumber those that do one quite a bit more than the other to explain what's shown here. Obviously there are some number of users like that, but it seems unlikely that they're a majority. My guess is something is distorting the data, and the most likely culprit is incorporating inactive users in the data. If you do include them then all of the averages for posts move super close to zero, and anyone that does anything becomes an anomaly, hence you don't see much correlation.
    – Servy
    Commented Nov 5, 2018 at 21:50
  • 9
    @joran That should result in very strong anti-correlation. If people with lots of questions have few answers, and people with lots of answers have few questions, then you can look at either and make a good guess as to the other (if you see lots of questions you can expect few answers, and if you see lots of answers you can expect few questions). The only exception is users that aren't active at all, which will have roughly equal numbers of questions and answers (with both being at or near zero). So no correlation basically means inactive accounts are counted, and dominate the data.
    – Servy
    Commented Nov 5, 2018 at 22:00
  • 8
    @Servy The absence of that particular correlation is interesting to me as well. We see plenty of people who come to ask a question or a few questions, but there just isn't evidence of large numbers of users who ask many questions, in the way that there are users who answer many questions.
    – Julia Silge StaffMod
    Commented Nov 5, 2018 at 22:07
  • 7
    @Servy We are actually interested in less active users, because most content is posted by them. This analysis did not include users who took no actions (all zeroes) but the goal of this analysis is to build better guidance for users learning about our site so less active users are important.
    – Julia Silge StaffMod
    Commented Nov 5, 2018 at 22:18
  • 7
    @JuliaSilge most content... meaning most questions (considering there are ~25million answers and ~16million questions on SO)? Or are you saying most people only post one answer and then leave the site? If the latter, I find that quite surprising.
    – TylerH
    Commented Nov 5, 2018 at 22:29
  • 7
    @JuliaSilge , Just a bit of data visualization formalia, the legend doesn't seem to reflect the transparency of the data points. So the effective (mixed with white background) color of data points cannot be found in the legend.
    – visibleman
    Commented Nov 6, 2018 at 2:12
  • 4
    @Yuca I mainly use R in my data science work; I made that plot with R and ggplot2.
    – Julia Silge StaffMod
    Commented Nov 7, 2018 at 20:33
  • 6
    Perhaps I'm preocupied with votes, but I found the downvote-question disconnect and the upvote-answer correlation telling. Upvoting members seem to be more involved in generating site content as a generalization. Commented Nov 8, 2018 at 18:54

22 Answers 22

143

Do you have topic ideas for more data science time adventures?

One of the issues Stack Overflow struggles with is the large Close Votes queue (currently almost 9K posts!). I'd like to see some analysis on what factors contribute to a post actually being closed as opposed to the close votes just aging away.

Moreover, there are definitely users that just gave up monitoring this queue (me, for one), and use close votes as (if) they come across posts they feel should be closed. I'd like to see some analysis on whether this is an effective behavior, or just a waste of everyone's time.

12
  • 14
    The CV Queue has been at or about 9k for almost its entire life. This is because some users stop reviewing for good as other reviewers come into the reviewing pool cough cough. It's also because we are limited to a paltry 40 close votes in the queue per day, where in almost all cases (9 out of 10 possible close reasons, including custom), the post requires five separate users to vote before it is closed. On this subject, I'd be interested to see how many different users participate in the CV queue each day.
    – TylerH
    Commented Nov 5, 2018 at 22:20
  • 18
    @TylerH The size of the CV queue has changed a number of times. Every time as a result of changes to how items enter or leave the queue (either how posts time out of review, or what types of actions add a post to the queue). So the number doesn't mean anything (they literally change how items enter/leave the queue to get whatever size they want) but it certainly has changed over time. They could make it go to zero tomorrow if they wanted, or increase it to millions. The size of the queue isn't actually a sign of posts that are likely close-worthy but aren't.
    – Servy
    Commented Nov 5, 2018 at 22:26
  • 2
    @Servy the CV queue didn't change in numbers that much (maybe 1k-2k more) the last time something big changed (close vote aging)... at most it went from spiking between 8k to 12k to stabilizing around 9k-10k.
    – TylerH
    Commented Nov 5, 2018 at 22:27
  • 18
    @TylerH For quite some time after it first come out it consistently sat in the several hundreds of thousands of items range. People kept complaining about how many items were in the queue, and about how the number was always going up over time, not down, so a change was made to much more aggressively age items out of the queue.
    – Servy
    Commented Nov 5, 2018 at 22:29
  • 5
    @TylerH: Evidence: What can be done about the massive close votes queue on Stack Overflow? - "There are (at the time of writing this; see edits at bottom of post) 54.2k questions with close votes on the review page on Stack Overflow.". And Daily close votes queue limit - "This question is related to this (jan23), this (mar 12) and many others; with the difference that close queue on SO today is 20k longer = 74k" Commented Nov 5, 2018 at 23:07
  • 3
    @PeterMortensen I guess it's only been 10k since I joined, which in my defense does seem like forever ago.
    – TylerH
    Commented Nov 6, 2018 at 4:02
  • 1
    Related feature request Commented Nov 6, 2018 at 16:50
  • 2
    Couldn't really make it go to zero without essentially turning it off, @Servy - there are ~2K new tasks a day that enter the queue, so even the most extreme aging settings could only reduce it to... about 2K (fluctuating by day and over the course of each day of course). OTOH, could make it as large as desired, given enough time.
    – Shog9
    Commented Nov 11, 2018 at 0:35
  • @Shog9 Yeah, to go to literal zero you'd need to make more drastic changes than just the timeout time, like changing the number of actions needed to move an item out of the queue, changing what adds items to the queue to limit the input (not adding items to the queue when it seems likely that item is going to just age out), etc. I'm not saying any of that is a good idea, I'm just saying you can tweak it to do what's most useful. I don't think having a smaller queue is actually useful, so I don't think changes that would accomplish it for its own sake are worthwhile.
    – Servy
    Commented Nov 12, 2018 at 14:33
  • 5
    Do you guys think every 10 (or some other number of) helpful flags should become like 1 rep point (or something like that) to incentivize people on reviewing queues more frequently? Does that make sense? Commented Nov 13, 2018 at 12:38
  • 4
    Since the queue is so large, perhaps lowering the reputation needed to approve or deny close requests should be lowered to you have more users to help maintain the site?
    – Bear
    Commented Nov 13, 2018 at 21:50
  • 9k is low, lol. I remember several years back when it was in the 30k range, I believe it was a few times higher than even that at one point. Commented Nov 25, 2018 at 13:13
109

Do you have topic ideas for more data science time adventures?
One thing I noticed when we declared war on comments first started our "be nice" efforts and really focused on cleaning up comments, was that my own behavior changed so that I stopped leaving comments and started instead downvoting and close voting more. (It wasn't intentional, just something I recognized afterwards.)

I would be interested to see behavioral trends of this kind before and after our "be nice" policy changes -- perhaps use the date of that first blog post as a 'delineator.' Were people more likely to leave comments before? Are they more likely to downvote+close and not comment at all after?

18
  • 3
    Noticed the same.
    – PM 77-1
    Commented Nov 5, 2018 at 22:27
  • 30
    Personally I found the "be nice" effort way more insulting and demeaning than what had existed previously, so I've mostly stopped leaving comments entirely. Commented Nov 9, 2018 at 20:30
  • 12
    I don't understand this behavior. Why wouldn't you just take the few extra seconds to be nice? Or, if you don't have the time, just do nothing? Why are downvoting, close voting, and commenting correlated instead of separate? I wouldn't avoid a downvote because Ieft a comment, for instance. If it's bad enough for a downvote, then it gets a downvote, and also possibly a comment.
    – trlkly
    Commented Nov 11, 2018 at 3:13
  • 24
    @trlkly: I think the issue is that it's difficult for some commenters to know how some questioners/answerers will interpret their comments, especially when these comments can be critical or the thing being commented on falls outside of community norms and needs correcting. Downvoting expresses some of what the folks would like to say, but cannot start a comment-war because it is anonymous. I'm not sure if it's the right thing, but I think it's an understanding able thing.
    – Richard
    Commented Nov 11, 2018 at 6:55
  • 5
    @trlkly we all have limited time on our hands. As far as I am concerned, the two options aren't "be nice" or do nothing. The two options are to either (a) do a lot of actions that take less time and have less impact (just downvote and close vote), or (b) do a less number of actions that take more time and may have more impact (engage in a comment conversation in addition to the votes). It's far easier to do (a). What incentive do I have for doing (b)?
    – muru
    Commented Nov 14, 2018 at 0:50
  • 2
    @muru The exact same incentive you had before the niceness policy. Nothing you said is any different before the niceness policy was introduced. If downvotes and close votes are less effective but easier now, then that was true before. If commenting was more effective but more difficult, then it remains more effective but more difficult.
    – trlkly
    Commented Nov 14, 2018 at 1:02
  • 2
    @Richard, But downvotes and close votes don't express anything similar to comments. Comments are for improving answers or questions. Downvotes are for decreasing the q/a in the system. And close votes are for an attempt to close and delete the q/a. Sure, you can do two or three of these things to the same question or answer, but they aren't similar goals. There is no reason that, if you were just going to comment before that you would now downvote or close vote. You should still only be doing that if you would have anyways.
    – trlkly
    Commented Nov 14, 2018 at 1:05
  • 2
    @muru The claim being made that, because of the niceness policy, posters are downvoting and close voting more often, rather than leaving comments. This does not make sense. These are completely separate actions that accomplish separate things. There should be no case where you would have just left a comment, but now will downvote and close vote. If you would have just left a comment before the niceness policy, but now don't want to, then you should do nothing. Not downvote when you wouldn't have before.
    – trlkly
    Commented Nov 14, 2018 at 1:15
  • 4
    @trlkly is that really the case? Plenty of people have whined to me that downvoting is for extreme cases and that I should comment and ask for improvement first. And I think many people did follow that (though I personally don't follow that rule - I liberally dole out votes of all kinds, and retract as needed). Now, though, the other advice is that if you can't be unambiguously nice, you shouldn't comment. So now people just skip the comment step.
    – muru
    Commented Nov 14, 2018 at 1:26
  • 12
    Downvoting is not for extreme cases; per the help hover text it's for questions that are poor quality, poor fit, or don't show any research or effort. My suggestion in the post was to use the data available to quantify behavioral changes before and after the time the anti-comment blog post went up. While correlation would not imply causation, as usual, I am interested if the changes I saw in my own behavior because of policy changes were part for the course. Commented Nov 14, 2018 at 15:25
  • 2
    itt: people so keen to be nasty that when asked to be nice find NEW ways to be nasty!
    – Loofer
    Commented Nov 14, 2018 at 16:51
  • 5
    Uh, the downvoting hover text guidance isn't new. That's how the functionality's been for years (at least since I joined 8 years ago.) What's changed is the fact that comments are now scrutinized for some arbitrary "niceness" quality, so instead of leaving comments to try and help get the question into shape we just downvote and move on instead. Once bitten, twice shy. @Loofer. Also what is "itt"? Commented Nov 14, 2018 at 17:10
  • 1
    @RoddyoftheFrozenPeas itt means "In This Thread".
    – Major
    Commented Nov 14, 2018 at 20:37
  • 4
    I don't understand why this is so hard to understand. Most people were not "keen to be nasty", but they were not also keen to coddle either. What might have once been "This isn't a homework service, you need to at least try solving this yourself first" is now just DOWNVOTE + CLOSEVOTE. Thank u, next. Commented Nov 24, 2018 at 13:49
  • 1
    1) "Be nice" is subjective. What's nice here in Germany is very different from what's nice in the states. 2) Engineers are direct. Direct != mean. People learning to code need to learn this. It's not a negative; in a lot of ways, it's a positive. 3) I kind of left SO altogether when the onslaught of repeated low quality Q's and A's came around. One can only try to fight it for so long. Commented Nov 25, 2018 at 13:15
48

Do you have topic ideas for more data science time adventures?

I do have a few small ideas for some adventures. I have tried to explain the reasoning behind why I need that data. Most of these are trying to rethink the priveleges themselves.

  • Reputation vs Answer flagged for deletion

    One thought which has always troubled my mind is the 50 rep limit needed to comment. The limit is quite good to defend the site not only from getting drowned in thousands of "Thank you" comments, but also spammers and abusive trolls.

    However, one fact which I noticed was that users with reputation anywhere between 20 to 50 do post non answers with the comment "I don't have enough reputation to post a comment". Would it be a good idea to reduce the commenting privilege from 50 rep to 25 rep, or 30 rep? In this way we would still prevent users from posting bad comments, while keeping the NAAs from 25~50 rep at bay. This however would not be a great idea, if there aren't much users from 25~50 rep who are posting NAAs. Therefore we would need some data here.

    That brings me to the question that I need to ask, can we get some data regarding the relation between reputation and answers flagged for deletion?

  • Reputation vs Tag creation

    Tag creation privileges is now available at 1,500. This reputation level is very easy to achieve on Stack Overflow. Or, putting it in a different way, there are way too many users with enough reputation to create tags. However the issue is that there are many tag related problems that occur, which include:

    The other issue here is that we are constantly recreating the tags which were once removed from the system, including those tags which followed the entire burnination procedure.

    The privileges to cleanup the tag mess is:

    • 2,000 rep (in order to edit post and remove the tag)
    • 3,000 rep (in order to close off topic questions)
    • 10,000 rep (in order to delete closed bad questions)
    • CM (in order to mass retag)

    ... which are all above the reputation level needed to create a tag, which is 1,500. Perhaps having a reputation level as low as that is actively harmful to the site? This thought wouldn't make much sense if the data shows that users from all across the reputation spectrum are creating bad tags.

    Therefore a good data science parameter would be to see how many users are creating tags that gain atleast 200 questions, and what their reputation is.

  • Close vote count vs Time

    This is another one of the interesting questions that I have since long. How many questions end up with just 4 close votes, and never get the 5th? Remember that our close vote queue does not have a way to filter out posts that have 4 close votes. Therefore, there is a very high chance of questions with 4 close votes never getting closed.

    It certainly is hard to visualize this using data, and I am not quite sure as to how to go about this, but I guess you would have a better idea. One idea which I am thinking is that the time taken for the 5th vote, if it is too large compared to the time taken for the 2nd, 3rd or 4th votes, then there certainly is a clear message that the close vote queue does need a system to filter questions with a given number of close votes. Similarly, if there isn't, then we can go ahead with whatever system we have now.

    Thus, coming to the question, can we get a graph of the average times taken to cast the nth vote (where n goes from 2 to 5)?

  • Reputation vs Edit override

    This is something which I noticed recently. The OP of a post can override the consensus of the review on a suggested edit of their post. Some of the new users who aren't aware of how we need to format, or the non usage of tag lines and signatures, utilize this privilege to override suggested edits which correct those issues with their post.

    This act is harmful not only to the site, as they roll their post to the bad state which it was previously in, but also melancholic for the editor as they no longer have their 2 reputation. Even though I have seen this happen occasionally, it has been frequent enough for me to think if the edit overriding ability should be a privilege based on reputation, say 25 or 30. However, without backing data, I cannot come to a valid conclusion here.

    Therefore, a good data point would be the correlation between reputation and edit approval overrides, where the override has been rolled back.

  • Gold Tag Badge vs typo accuracy

    Thanks to the gold badge mjolnir, the number of questions being marked as duplicates on the site has increased drastically. However, with the same privilege, I also feel that a user would have earned enough trust of the community to single handedly mark posts as a typo.

    This would be a great idea, if we have some data backing up. If lots of gold badge users are voting to close as typo accurately, then it also implies that we could have closed the posts more quickly had they had a typo hammer. That also would imply that we would have lesser number of bad answers that just correct the typo. This idea would fall apart if there is a very low number of gold badge holders voting to close as typo.

    This now leads me to the question, Can we get a graph that can correlate the accuracy of a question closed as typo, with whether one of the posters had a gold badge in the tag?

10
  • 2
    Extending Mjölnir powers to typos might help some, but (as a contributor in some niche tags) I feel it might be a lot more useful if we'd correlate the required number of close-votes with the Q/A influx of a tag (maybe the highest-volume tag on the question). Commented Nov 6, 2018 at 12:04
  • 9
    @Bhargav: "This would be a great idea, if we have some data backing up." It should be noted that data is not the only (or even the primary) issue preventing that. The thing about dupe-hammering is that you have to actually find a duplicate before you can do it. Thus, you have to provide some proof up-front that you're closing the question properly. With typo questions, this isn't the case. It therefore becomes way too easy to abuse one's powers. It's too easy for a group of users to decide that "typo" is the new "too localized". Commented Nov 6, 2018 at 14:40
  • 2
    Yes, @NicolBolas, that's true. I hadn't thought of that while writing this. I guess perhaps two users with gold badges, would be a better way to reduce the outright abuse. We certainly can't prevent abuse completely, but probably try to reduce the amount of abuse. (I do agree that there are a few gold badge users who are in cahoots with each other). Looking at the data would probably be just one of the things which we need to look at, and a typo hammer would certainly need more thought.
    – Bhargav Rao Mod
    Commented Nov 6, 2018 at 23:00
  • 1
    @NicolBolas I don't find any problem with that. We, contrary to before, have a humongous amount of people with power. Heck, we have moderators in almost all main languages tags. BTW, who says that gold badge owners find the duplicate but instead they just know the most common one and have it in a bookmark? There's no "effort" in that according to your argument.
    – Braiam
    Commented Nov 7, 2018 at 1:03
  • 1
    @Braiam: "There's no "effort" in that according to your argument." My argument didn't include "effort"; I don't know why you quoted that word, since I didn't use it. My argument is about having to prove "up-front" that you're closing the question on good reasoning. It has nothing to do with how easy it is to do; it's about you having to provide the duplicate. If you just randomly pick a question as a dupe, you're clearly abusing the rules and can be sanctioned, so people don't do it. By contrast, that kind of paper trail doesn't exist for typo questions. Commented Nov 7, 2018 at 1:38
  • 2
    @NicolBolas "you have to provide some proof up-front that you're closing the question properly" = "work" = "effort". You need to spend more energy, that's your core argument. My core argument is that that effort/work/energy was spend once and reused again and again, thus reducing the amount of energy in average spent by the user. Most people that have close votes are programmers, and programmers tend to not do the same action several times.
    – Braiam
    Commented Nov 7, 2018 at 1:57
  • 3
    @Braiam: "= "work" = "effort"" No, it's about proof, provided up-front. That has nothing to do with how much effort gets spent to provide it, and everything to do with the ability to quickly determine if the person is abusing the system or not. Stop arguing positions I'm not holding. Commented Nov 7, 2018 at 2:10
  • 1
    @NicolBolas providing = work. You writing a comment is work. You spending energy trying to convince me that it isn't is wasted work that should be spend on something more productive like the close queue. Time and energy are resources, you are asking the gold badge owner to spend resources by showing proof upfront. I tell you that said resources were spent once and saved the result for the later cases where it likes. Don't you have a list of commonly duplicate targets? Heck, there's even a query that gets that for you. There's no incentive in doing what you say it "happens" on dupe vs typo Q's.
    – Braiam
    Commented Nov 7, 2018 at 11:45
  • 4
    @Braiam: I'm sorry, but I cannot have a reasonable discussion with someone who declares two things are the same thing when they're not. It's pretty clear that my point has nothing to do with effort and was all about stopping abuse. That you cannot see that is unfortunate, but that's the end of it. Commented Nov 7, 2018 at 14:27
  • 1
    @NicolBolas That you aren't familiar with the concepts of another science doesn't mean that such concepts doesn't exist. Look for the definition of work and energy in physics.
    – Braiam
    Commented Nov 7, 2018 at 14:30
37

Do you have topic ideas for more data science time adventures?

There was a comment I saw somewhere that this time of year (new school terms) tends to lead to an influx of bad questions on the common learning-language tags (java, etc.).

Some analysis of year-round trends for tags would be interesting

2
  • 5
    The Eternal September?
    – muru
    Commented Nov 20, 2018 at 8:21
  • 1
    @muru: No, actually the real September, or whatever months people on beginner programming courses are most active (and can we separate college from MOOC from self-taught from ProjectEuler/SPOJ/etc. from TopCoder)
    – smci
    Commented Nov 22, 2018 at 11:25
21

Elaborating on my comment to Kevin's answer

Do you have topic ideas for more data science time adventures?

Investigate the effects of the "Be nice" policy blog post and new CoC by

  • running sentiment analysis on new users' posts and compare how new users are "welcomed" before and after that policy.
  • detecting behavior changes after that policy (maybe focus on veterans here); a way to do that could be to look at the evolution of awarded badges (like civic duty, altruist...) / user
  • finding some new user satisfaction metrics, e.g number of posts from new users / complaints and their sentiment on meta (not sure if that would be helpful as new users are unlikely to go on meta), other sources like number of google results "stack overflow rude"...
0
15

Do you have topic ideas for more data science time adventures?

I'd like to see the correlation between the number of edits on a post which were made by the OP, vs edits which were made by people other than OP, vs. the score.

6
  • 8
    In order to support this, there really needs to be a marker for which questions reached HNQ; that throws score way off.
    – WBT
    Commented Nov 5, 2018 at 21:40
  • 1
    "the number of a post's OP edits" needs several scans - perhaps rephrase? Commented Nov 5, 2018 at 22:42
  • 2
    @PeterMortensen I've rephrased it a bit for Stephan; better?
    – TylerH
    Commented Nov 5, 2018 at 22:44
  • 4
    @TylerH people always spell my name wrong, even when it's written down.
    – Nissa
    Commented Nov 6, 2018 at 3:58
  • 1
    @StephenLeppik I finally got conditioned to use an 'a' from another user in chat after like 3 years... now you're telling me I have to break the habit?!
    – TylerH
    Commented Nov 6, 2018 at 4:01
  • 1
    @TylerH use an æ character by default. All the Stephæns will never know ;)
    – RoB
    Commented Nov 22, 2018 at 20:40
11

Do you have topic ideas for more data science time adventures?

I'd love to see the progression of users' written language as they participate in SO, as a function of time and of the magnitudes of the features you mentioned in this (your) meta-post: reputation, upvotes, etc.

For example, my case. I am aware of how the style, length, and complexity of my posts in any particular online community changes as time goes by. So does my willingness to participate in particular kinds of threads, by number of participants, general sentiment of the posts, particular users involved, weekday, time of day, etc.

Some of the metrics that might be interesting to predict/regress would be from the simple:

  • absolute text length, text length ratio vs the OP length, relative to the other answers/comments
  • lag between time of OP to answer/comment, from last answer/comment, ratio vs avg lag of answers/comments
  • Flesch-Kincaid Readability of answer/comment, ratio of FKR to OP's FKR, to average FKR of answers/comments

to the more complex:

This kind of window into people by observing their language has fascinated me since back in the BBS days, reading QWK packets to the whine of MNP2 modems' handshakes, and is one of the main reasons I've been drawn back into the data science light from my dark winter of IT management.

1
  • 2
    I definitely apologize less than when I started here. :) Commented Nov 12, 2018 at 20:47
10

Do you have topic ideas for more data science time adventures?

I always wondered what influence the order of the answers, the already given score and the rep of the answerers have on the voting behavior (independent of the content of the contribution itself). There is quite a number of meta questions about this, but none of them did really give conclusive results. Given that the voting is such an important part the Q&A system of the SEs, it might be worthwhile to investigate it better.

One way might be to display different orders, scores and reps to some visitors and compare their voting behavior with the normal behavior.

Another topic is duplicates. Do more established tags get a higher and higher percentage of duplicates (all has already been asked) or not? If not, may it be because finding duplicates gets harder and harder for larger tags?

2
  • 2
    Exploring some of these questions would involve doing an experiment on Stack Overflow (i.e. an A/B test, changing core behavior of the site for some users, etc) rather than analyzing data we already have, but I think these questions are very interesting!
    – Julia Silge StaffMod
    Commented Nov 6, 2018 at 23:03
  • 1
    @JuliaSilge Yes, you're right. I added a small paragraph about duplicates. Maybe there one can do more with analyzing data that is already there. Commented Nov 6, 2018 at 23:06
9

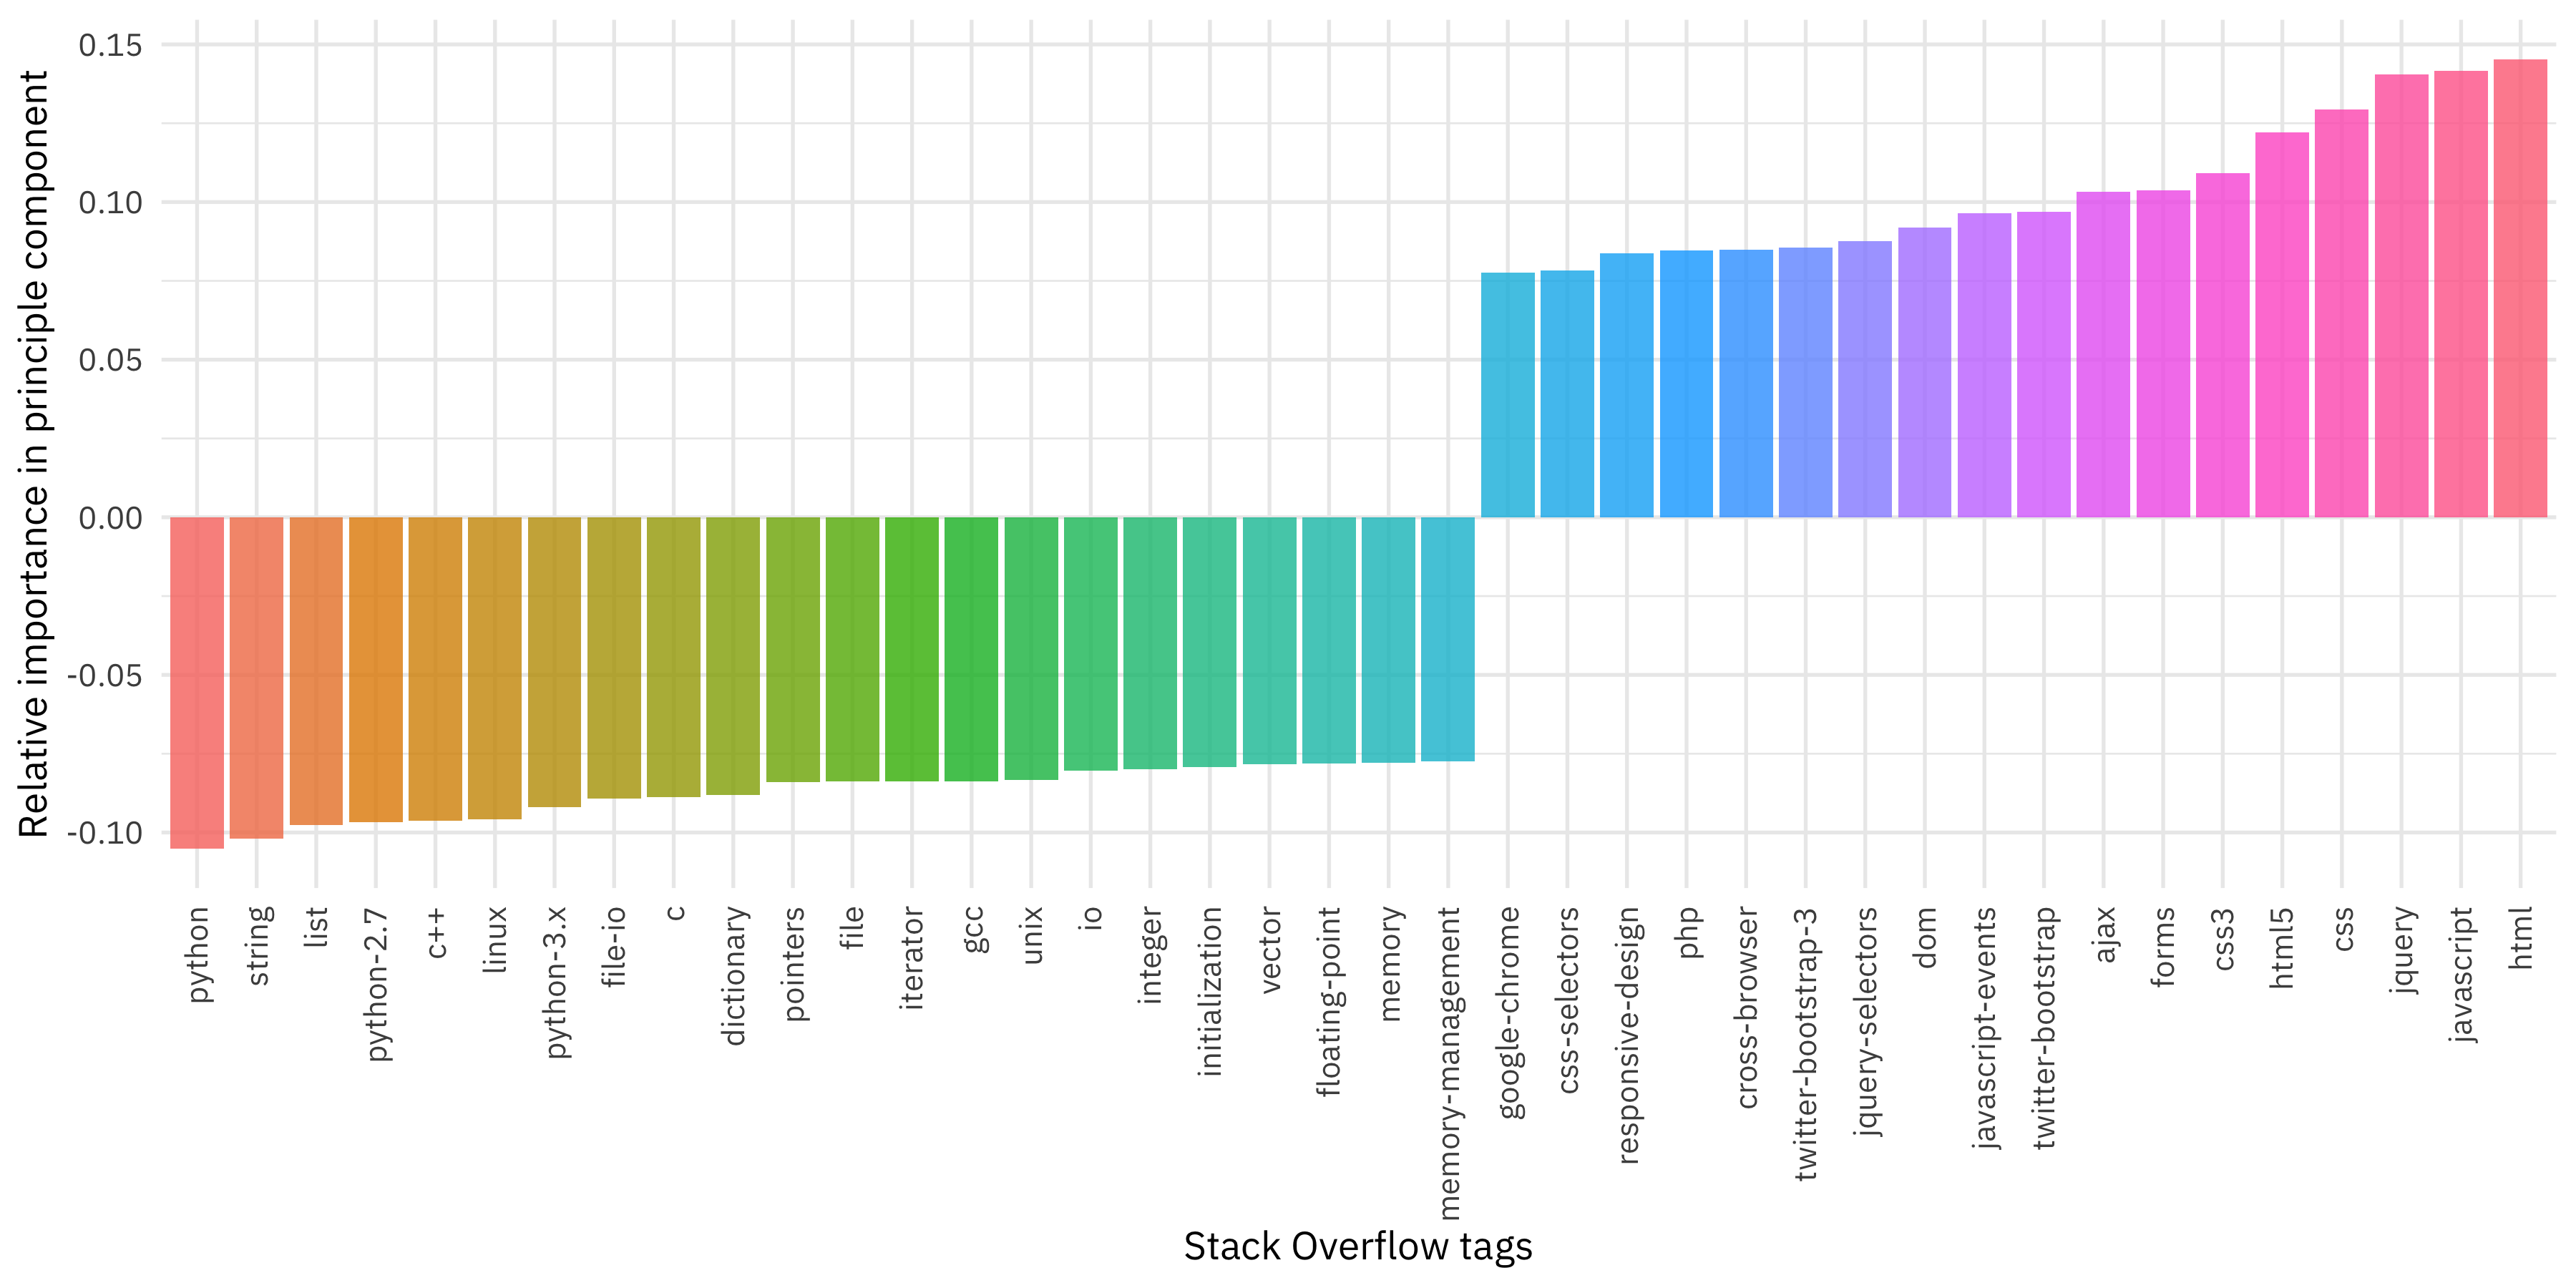
As I have been keeping up with comments and answers here, I notice several folks expressing interest in clustering users and/or projecting the high dimensional data we have about users to understand them (us) better. This is an area where I've already done some public work, so I thought I'd add it here.

It's more than "bite-size", but check out my blog post and conference talk from earlier this year about understanding principal component analysis using Stack Overflow data.

enter image description here

3
  • 4
    If you run such an principle components analysis in the "actions" data from this post, does it show groups of users that use the site in different ways?
    – sth
    Commented Nov 18, 2018 at 18:12
  • The blog post shows a strong appreciation for PCA. Wouldn't it be interesting to try non-linear dimensionality reduction methods as well? (t-SNE, UMAP, ...)
    – E_net4
    Commented Jan 13, 2019 at 19:37
  • What is the interpretation of the figure? Python, C++, and C are not really used in web development (despite Django and Flask) due to hosting restrictions? Commented Sep 27, 2019 at 20:29
8

Interesting results, thanks!

Do you have topic ideas for more data science time adventures?

I would like to see some result addressing the "elitism" or "welcomingness" (this a word?) of the community. I see sometimes poor questions from new users that get profusely downvoted (I'm not arguing whether that's right or not), which I fear may drive them away; it would be interesting to see how the first interactions with the community (good or bad) affect the following behavior of new users (whether they ever ask again, they answer, etc). Also, whether we "respect" more the questions and answers (or comments) by users with more reputation, upvoting them more, interacting more with them, editing them less, etc (could there be a way to tell if this is because these are better posts or just because of the reputation?).

I would also be interested in gender differences. I realise this may not be easy, or feasible at all, but since this is a dominantly male community (according to the survey), it would be interesting to know if we are "nicer" or "meaner" to (apparently) female users, if they post more or less, etc. Do you have some way to estimate the "perceived femaleness" of a user based on it's profile pic and name, or something like that?

Finally, I think it could also be cool to have comparative statistics between languages. Which ones bring more new users, which have more up/downvotes, which more answers and which more comments, which get more posts during the weekend, etc.

7
  • 2
    These are some great ideas! Some of these are a bit more than "bite-size" but super interesting and important to our community.
    – Julia Silge StaffMod
    Commented Nov 7, 2018 at 15:35
  • 2
    I was just debating whether I would dare suggest the gender and upvote/downvote thing. It seems to me that every time I suggest something controversial like that, I lose about a six hundred reputation points. Which I don't care about so much, except I apparently do notice it. Whatever, now I can just upvote you. Commented Nov 9, 2018 at 16:10
  • @ElisevanLooij Thanks :) Votes in meta do not affect your reputation, though, actually so you can speak your mind without worrying about losing it (unless some user goes the extra mile of downvoting posts in your main because of some post here, which, I want to think, most users engaging in a discussion in meta would not do, but then again who knows).
    – javidcf
    Commented Nov 9, 2018 at 16:26
  • @jdehesa "t would be interesting to see how the first interactions . . ." That's easy. They do the same thing people do when the go to anywhere else and are treated rudely. They leave. While SO is a good place to find answers, It's not the only place. Commented Nov 9, 2018 at 20:32
  • "...which I fear may drive them away..." That is probably something that the StackExchange team knows very well, looking into retention rates and how they are influenced by badly received questions, but I'm not sure they want to publish this data. Maybe they could kind of comment how much better retention is when the first question is positively received, giving the community a hint how to better treat first time questioners. Commented Nov 10, 2018 at 13:32
  • "Do you have some way to estimate the "perceived femaleness" of a user based on it's profile pic and name, or something like that?" I fear that perceived femaleness would not correlate a lot with the true gender (also because many people do not have much profile information). With analyzing gender behavior, I think, the problem is really that the StackExchange team doesn't know it on a single user level. Maybe they could ask for volunteers that would be willing to disclose their gender to them (for science). Commented Nov 10, 2018 at 13:35
  • 3
    @Trilarion Yes, I realize perceived and actual gender may be quite different, but (personally) I am interested in whether people treat users differently when they think they are female (whether or not they actually are). It would also be interesting, though, to see differences in behavior (in general) between actual genders, too.
    – javidcf
    Commented Nov 10, 2018 at 15:58
7

Do you have topic ideas for more data science time adventures?

Yes. Here are some ideas:

User clustering

I would like to see clustering of certain user behaviors. You could do this with unsupervised learning and then make observations on what typifies users who are in the larger+tighter clusters, and/or you could make pre-defined clusters like "users that down-vote a lot" or "users whose comments tend to be up-voted" and see what co-occurrences pop up.

Timeliness analysis

It seems that timeliness matters, and that answers with high scores tend to be posted quite soon after their questions. I'd love to see this plotted, especially if you could break down which tags are more correlated (or decorrelated!) with timeliness.

Something something something Jobs

I know there's a major initiative at Stack Exchange, Incorporated to push for the Jobs and Teams products and to make more money to fuel the Q&A sites with something meatier than ads. When I'm hiring, I mostly just want better access to users that meet particular metrics (and then, since there's no private messaging capability here, hope there's some way of contacting them, like a Twitter handle). Perhaps I'm atypical, but since I'm a data scientist myself, I want to use my abilities to find candidates.

Maybe that's just allowing users to denote their current employer. This might be better suited to Microsoft (LinkedIn + Github synergies), but this correlation would be a pretty useful one in several ways, including but not limited to companies advertising their talent (e.g. "hey, I want to work with this amazing SO contributor" or in the other direction, "hey, this amazing SO contributor works for our competitor; maybe we could poach her"). Employers that make SO job listings would have access to additional tooling that lets them ease this process (a "now hiring" badge next to the company membership on users' pages, more information on the company page users link to, etc.

More in lines with fun analytics (erm, I mean "adventures"), there could be stats clustering users by their employers (or other organizations? Think of how Github allows groups for example). Leader boards of organizations' total scores, per-member scores, scores over time, scores per post, per-tag breakdowns for all of those, etc might help further gamify participation (i.e. time on site, i.e. ad revenue and promoting Jobs/Teams).

English language quirks

Most Stack Exchange sites —obviously especially Stack Overflow— are English-only, yet a large number of users do not speak English as their native language ... and since we're such a technical crowd, many of our native English speakers aren't terribly great writers. I bet there are quite a few examples of bad English syntax that could be plotted in ways that are very interesting to those of us with a passion for linguistics. Of course, you also have edit histories, so you can also plot corrections (though there might be too many complete rewrites for this to be tractable).

This is importantly not about "leader boards" (or "loser boards," whatever). It's about trends and what we might be able to learn from them. It's also an excuse for the SO data science team to play around with NLP.

1
  • 1
    I don't think SQL Server and R can answer your timelines analysis exhaustively. For that, a data scientist would need q and kdb+ time-series database. Commented Nov 21, 2018 at 18:37
6

Do you have topic ideas for more data science time adventures?

There is an expression: "#BI is about finding the answers while #DataScience is about finding the questions: that's the key to understand why you need them both."

I don't want to suggest ideas for more data science time adventures, without also suggesting BI solutions. An example follows:

  1. How likely users are to interact with questions and answers?

    1. How likely are users to click hyperlinks provided?

      1. If the hyperlink occurs in an answer
      2. If the hyperlink occurs in a question
      3. If the question has X number of hyperlinks, will an answer have Y number of hyperlinks (quid pro quo effect)?
      4. If, as a question/answer gets edited, does the amount of interactive content increase and eventually settle?
      5. Is there an optimal amount of interactive content that suggests users enjoy (upvote) content they can play with?
    2. How likely are users to run code samples if a content creator provides a runnable code sample?

      1. In an answer
      2. In a question
    3. Can we generalize running code samples to other forms of interactive content?

      1. I am thinking of Malcolm Gladwell's Tipping Point, where he discusses what made Sesame Street truly successful with children (in spite of its many mistakes), and how Blues Clues ultimately capitalized on those premium ideas to create the greatest children edutainment show of all time?
      2. Inspiring Idea: Julia, what can you do, as a data scientist, to create the Blues Clues moment for Stack Overflow?

I think this is critical information, because if you look at the history of Google search, the trend has been for Google to datamine the stuff behind the link and display it to you on the same page. In other words, how can you use data science to create effortless answers to search? Stack Overflow (and Stack Exchange) has started to do this more and more, but the below "meta-programming".

10 years ago, if you wanted to convert minutes to 1 year, you would search for "how many minutes in a year", and then be instructed by the school librarian that a better search would be "units of time conversion tables" or "time conversion calculator" or something less obvious like that. The answer to this question is so useful that Alexa is pre-programmed with the answer.

Gooogle Search: "how many minutes in a year"

7
  • 2
    What is "BI"? Business intelligence? Commented Sep 27, 2019 at 20:33
  • @PeterMortensen Yes. Commented Sep 30, 2019 at 19:36
  • 2.1.Less to none (with some rare exceptions like a really interessting queston or a special case that no one have ever seen bevor)
    – Hille
    Commented Oct 8, 2019 at 14:12
  • @Hille By "2.1. Less to none" Are you saying users are less likely to not likely at all to run a code sample in an answer if one is provided? Commented Oct 8, 2019 at 14:32
  • @JohnZabroski I think that most SO users do not run code which is supplied in a question as most of them are either that easy so you can find a solution by reading or so complicated that you need to put some time in it (which most of the users don't do). So I think that no one is really running the code snippets in question. But either way, the code a asker is supplying should (propper: must) be a MCVE otherwise it's difficult to help without wasting time.
    – Hille
    Commented Oct 8, 2019 at 14:35
  • @Hille It's an interesting perspective but we dont have data to validate. An MCVE is nice but how many questions have that? I ancedotally think CSS/JS questions tend to be the best at providing MCVE because of the "live demo" feature provided by Stack Overflow. If this enriches user experience, maybe Stack Overflow should spend less money on data science to understand user experience and more money on actually improving user experience? Commented Oct 8, 2019 at 15:02
  • @JohnZabroski yep, it would be difficulty to get the data. The only way I can think of a button next to the question "did you try the code? [y/n]", which on the other hand could influence the user to try it instead of just reading it. - I like little data adventures and I think that they're doing a great job with improving the user experience. Otherwise they wouldn't get any business customers :)
    – Hille
    Commented Oct 9, 2019 at 6:09
5

Has the new "Be nice" policy, flags and tools now called "Be welcoming" that sprang from https://stackoverflow.blog/2018/04/26/stack-overflow-isnt-very-welcoming-its-time-for-that-to-change/ resulted in people, um, being nice?

As said in the comments below, maybe focus on running sentiment analysis on new users' posts and compare how new users are "welcomed" before and after that policy?

3
  • 4
    Maybe focus on running sentiment analysis on new users' posts and compare how new users are "welcomed" before and after that policy
    – 7hibault
    Commented Nov 7, 2018 at 9:05
  • 1
    @7hibault that'd be a great separate answer Commented Nov 7, 2018 at 10:38
  • 7
    The 'be nice' policy is basically as old as Stack... Do you mean the welcoming blog article + the CoC?
    – Patrice
    Commented Nov 7, 2018 at 12:19
5

Critical reputation point

I imagine this has an effect on several different aspects

  1. Retention - compare how long a person has been active with their reputation. Is there a tipping point? (e.g. over 1k reputation users will be more consistently active)
  2. Questions, answers and comments - is there a point where people stop asking questions? Start writing more answers? Comments?
  3. Votes recieved - a bit of a chicken and egg one but perhaps a vote rate instead? Compared with reputation (difficult to untie the two though so conclusions from that are nigh impossible)
  4. Votes given out - do people become more generous after a certain point?
  5. Meta posts, votes on meta posts etc
1
  • 1.In my case it's the opposite, I'm getting more inactive as I get more rep passively
    – Hille
    Commented Oct 8, 2019 at 14:15
4

I have been investigating online communities such as Stack Overflow for some months. Trying to understand who is using the community is essential to improve it.

A good strategy to deeply understand something is: observe it considering several perspectives. In the Stack Overflow context, it means that a user should not be seen just considering his/her participation for example.

This paper might give you some insights for more data science time adventures. The work presents analyses related to the users' perspectives such as participation, linguistic traits, social ties, influence, and focus in order to better understand the rising of outstanding users in Stack Exchange communities.

I hope it helps you.

3
  • Interesting work. One thing to consider is that reputation is dependent on the activities but based on some scaling, the weights for which are determined by SE. So high rep or outstanding users are also going to be doing many things.
    – Elin
    Commented Nov 23, 2018 at 18:28
  • @ThiagoProcaci wow, what a contribution! Thanks for sharing your research. Can you let me know where it goes? Commented Sep 25, 2019 at 15:35
  • @JohnZabroski This paper was published in 2018. After that, I examined feature learning methods to automatically identify characteristics which make possible to perform the classification described in the paper. Now, I'm investigating metrics habitually associated with learning outcomes in MOOCs environments and verifying its relationship with reputation and correlated metrics. Thanks for your feedback! Commented Sep 27, 2019 at 21:24
3

Do you have topic ideas for more data science time adventures?

This is great information.

What about checking duplicate flags? I try to get to the newest questions as often as I can and to my surprise, most of them are labeled as duplicate (sometimes by the same user) within only a few minutes. Are you running ML to identify these duplicates of is these are flagged by users? I think this could be a good use of this space in a future post.

3

Do you have topic ideas for more data science time adventures?

I'd like to see some analysis on old questions that accumulated one close vote (but not more) and had zero close vote reviews.

Over time, I've voted to close many old questions (often as a duplicates); but often, these close votes have gone unnoticed, perhaps because the questions were so old.


Here's an example of what I'm talking about: RabbitMQ - Read message from Nodejs

This question should obviously be closed, and I'm not sure that anyone even reviewed it.

1

enter image description here

It's interesting to note that downvoting is more correlated to answers than questions. Looks like there is a lesser chance of getting downvoted if you ask more questions instead of answering them!

In other words, you have higher probability of getting downvoted if you post more answers than questions.

Beautiful correlation-plot Thanks!

8
  • 3
    Confirming the Hypothesis.
    – dresh
    Commented Nov 11, 2018 at 8:12
  • Good observation, nonetheless. Do add, if you would like to see other interesting correlations.
    – dresh
    Commented Nov 11, 2018 at 8:15
  • 2
    Anyone who wants to downvote, please leave behind your valuable comments too ...
    – Martin
    Commented Nov 11, 2018 at 9:05
  • 2
    Where do you see "getting downvoted"?
    – Willeke
    Commented Nov 11, 2018 at 23:08
  • Answering and downvoting (and commenting and upvoting too) are part of the process of responding to questions. I'm not surprised that they are not correlated with asking questions, which is a different process.
    – Elin
    Commented Nov 13, 2018 at 13:36
  • 10
    I downvoted because of "Beautiful correlation-plot". That was a really ugly correlation-plot, what with the unrecognizable colours and poorly defined labels.
    – anatolyg
    Commented Nov 13, 2018 at 19:40
  • 2
    @Anatolyg Beauty is in the eye of the beholder ;)
    – Martin
    Commented Nov 14, 2018 at 5:28
  • 2
    Or it could be that people who get downvoted on their questions are less disheartened than those downvoted on their answers. Commented Nov 23, 2018 at 12:05
1

I am part of one of those less active masses. I am not allowed to comment because I have not enough points. So the only thing I can contribute with is an Answer, which my thought(s) may not be sufficient for, since I only wanted to write a Comment. So I get downvoted. So I find less interest in hanging around at the stack*. site(s).

I see the major grouping "nitpickers" vs "friendly Q/A people" in Julias graph. My experience is that Nitpickers are often VERY focussed on formalities, i.e. not wanting to lead the discussion forward in the sense of broadening the knowledge.

See, even the nice hypothesis with graph above (by Martin) got "-1"! Was it because it is not an answer to the question (="What do you want to see?") but rather an interesting comment on Julias findings? (Answer != Comment) == -1.

And I also wonder if "Downvotes" means "getting" or "dishing out". I presume the latter.

(Even this Answer should only be a Comment, but, see reasons above. I expect lots of "-1" since it's not an answer, rather a comment.)

Finally (as an answer!) I would like to see results of a Machine Learning model: a "customer group profiling" where we see some 4-10 user groups, their sizes and lists of their expected behaviours. Are there really Nitpickers-Only, vs Friendly Q/A people as I suggested? How much do they nitpick? And what do the other (major) groups do?

BR

12
  • 7
    If you want to be able to comment, you will have to gain reputation first. But the comment limitation is not put in place to pester people of good will, as you seem to be assuming. Also, SO is meant to be a Q&A site, so that's why the "nitpickers" keep focusing on Q&A's and "not want to lead the discussion forwards " ...
    – Jongware
    Commented Nov 12, 2018 at 10:38
  • 1
    As to your question at the end, I've always found this answer very illuminating, especially the graphic.
    – Jongware
    Commented Nov 12, 2018 at 13:32
  • 3
    SO allows users to downvote without providing a reason for the downvote. In some cases, this policy leads to irresponsible downvoting. Try to focus on these questions: 1. what can I learn from here? 2. what can I contribute here? Always remember that a responsible(constructive) downvoter has the politeness and patience to correct you when you are wrong/ignorant. The majority of people on SO belong to this category.
    – Martin
    Commented Nov 12, 2018 at 18:49
  • +1 Nevertheless, it is always good to help and contribute every answer unless it is out of the context. I understand your frustration
    – knoxgon
    Commented Nov 13, 2018 at 10:44
  • 3
    @Martin it also leads to horribly irresponsible upvoting. Commented Nov 14, 2018 at 0:35
  • @Felix Gagnon-Grenier Upvoting has more potential to contribute value, than trigger-happy downvoting.
    – Martin
    Commented Nov 14, 2018 at 5:32
  • 4
    @Martin I don't share that viewpoint, and wonder why you think that. A good proportion of questions are typos, too broad, unresearched and generally off-topic. Upvoting that is absolutely not contributing value... Commented Nov 14, 2018 at 5:58
  • @Felix Gagnon-Grenier meta.stackoverflow.com/questions/251758/…
    – Martin
    Commented Nov 14, 2018 at 8:54
  • @Martin Oh, I know that post very well. It's quite a legend, posted quite a long time ago. I've read through the question and answers time and again. I wonder, again: did you read it? The answers, really do not go along the direction of your post. Did you have something in particular you wanted to cite? Or did you take the title like some kind of proof of something? Commented Nov 14, 2018 at 13:39
  • @Felix Gagnon-Grenier Yes i had read it, and it helped to fortify the hypothesis that, Upvoting has more potential in contributing value than trigger-happy downvoting.
    – Martin
    Commented Nov 15, 2018 at 6:33
  • 1
    @Martin I side with you. I am happy finding a question (stated as a duplicate to something by someone with a huge infallible memory and downvoted by someone) which still actually is answered by one or several persons. These scorned questions have helped me several times! It is clear from reading usr2564301's link that there are people who want to prune SO into something of a lawbook with dull precise content. But people aren't like that. Martin, I have even recently read a question like "How can I benefit more from my downvoting". But are we (I!) perhaps straying from the topic now? Commented Nov 15, 2018 at 8:14
  • @P Oltergeist i am glad that you did bring up the psychological perspective on Upvoting/downvoting.
    – Martin
    Commented Nov 19, 2018 at 8:32
1

Do you have topic ideas for more data science time adventures?
I would like to see a chart where x-axis is an index and y-axis is “reputation” and the data is sorted by reputation. This would show something equivalent to the “wealth” charts; e.g. the top 1% of people in the USA own 95% of the money —> the top 1% of stack overflow members have 95% of the reputation.

1
1

Do you have topic ideas for more data science time adventures?

Activity (number of question, answers, votes, comments,...) distribution between stack-exchanges.

Do people being active in different stack-exchanges have a strong correlation in their activities per stack-exchange or is it the other way around (they concentrate on one (a few) stack-exchanges at a time)?

1
  • Good suggestion. I'm not sure why this was downvoted. People are so rude on StackOverflow! Commented Feb 26, 2019 at 16:27
0

I wonder if it is possible to explore other simple models such as features clustering or graphical models. I see room for interesting questions. What are the main attitudes behind these correlations? Downvotes is positively correlated with flags but also with upvotes in some extent. Answers positively correlate with comments that are also positively correlated with updates and votes. It is about to be more active or less active? Some people are more positive than others? Can we cluster user with their activity? However, very nice analysis and interesting ongoing projects!

You must log in to answer this question.

Not the answer you're looking for? Browse other questions tagged .