I tried my hand at the Stack Exchange Data Explorer to see if I could gain any insights about the number of active bounties through time.
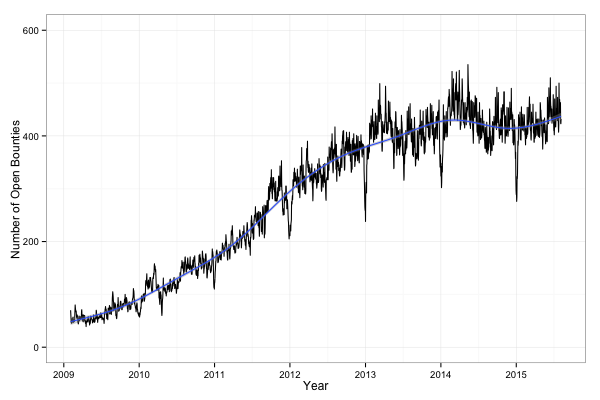
The number of active bounties increased roughly linearly from 2009 until right around 2013, and it appears to have stabilized to slightly above 400 since. A better estimate of the typical number of open bounties over the last 2.5 years is probably 425, though it fluctuates pretty widely, sometimes going below 350 or above 500:

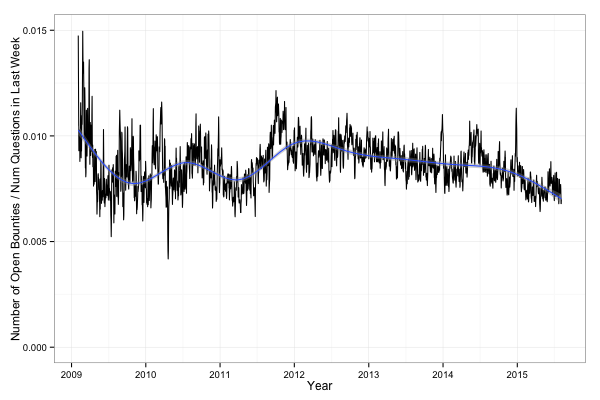
Because the number of questions being asked on Stack Overflow has been increasing through time, this stabilization of the number of open bounties corresponds to a decreasing number of open bounties normalized by the number of questions in the past week -- since 2012 this value has decreased from about 0.01 (1 bounty per 100 questions) to roughly 0.0075 (1 bounty per ~130 questions).

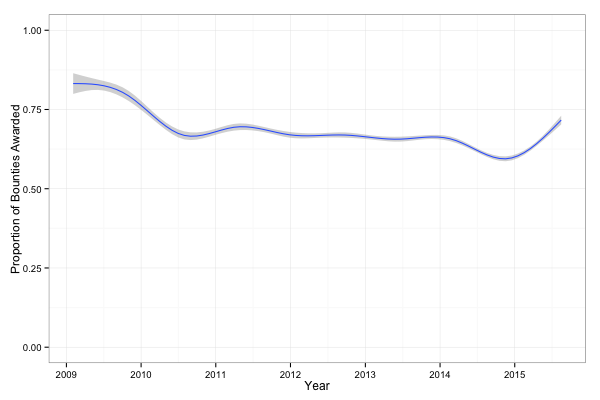
One reasonable theory about why the number of bounties has decreased relative to the number of questions is that bounties are becoming less effective (and therefore awarded less frequently). While there has been a decrease in bounty effectiveness in time (though interestingly a sizable increase in 2015), this seems like a pretty minor effect:

In short, there does seem to have been a stabilization in the number of open bounties through time, which corresponds to a decreasing number of bounties per question asked. This effect probably can't be fully explained by the decreasing effectiveness of bounties (as measured by proportion of bounties awarded).
Methodology: I grabbed all bounty start dates and posts (these are questions) with year-specific queries like:
SELECT v.PostId, v.CreationDate FROM Votes v
  INNER JOIN Posts p ON v.PostId=p.Id
  WHERE v.VoteTypeId=8 AND YEAR(v.CreationDate) = 2009;
I grabbed each year separately to get around the limit of 50,000 records returned by the Stack Exchange Data Explorer. Note that this is an inner join with the Posts table, so bounties on posts that no longer exist were ignored (this is a small number of posts).
I similarly grabbed all bounty end dates and posts (these are either questions, when ParentId is missing, or answers, when ParentId is present) with:
SELECT v.PostId, p.ParentId, v.CreationDate FROM Votes v
  INNER JOIN Posts p ON v.PostId=p.Id
  WHERE v.VoteTypeId=9 AND YEAR(v.CreationDate) = 2009;
Finally, I grabbed the number of new questions on each day with:
SELECT CONVERT(date, CreationDate), Count(*) FROM Posts
  WHERE PostTypeId=1 GROUP BY CONVERT(date, CreationDate);
If the list of all csv files for results from the first queries are in variable add.csv, the list of all csv files for results from the second query are in variable sub.csv, and results of the third query are in file numq.csv, then you can run the following R code to match bounty start and end times (throwing away starts and ends that are not matched) and generate all the plots:
# Read in bounty start and end, combining into data frame dat
dat1 <- do.call(rbind, lapply(add.csv, read.csv, stringsAsFactors=F))
dat2 <- do.call(rbind, lapply(sub.csv, read.csv, stringsAsFactors=F))
dat2$FullId <- ifelse(is.na(dat2$ParentId), dat2$PostId, dat2$ParentId)
dat <- data.frame(id=c(dat1$PostId, dat2$FullId),
                  date=c(dat1$CreationDate, dat2$CreationDate),
                  add=c(rep(T, nrow(dat1)), rep(F, nrow(dat2))))
dat$date <- as.numeric(as.Date(dat$date) - as.Date("2009-01-01"))

# Throw away start or end indicators that are not matched
spl <- split(dat, dat$id)
spl.keep <- lapply(spl, function(x) {
  add.day <- x$date[x$add]
  sub.day <- x$date[!x$add]
  if (length(add.day) == 0 || length(sub.day) == 0) return(NULL)
  keep.add <- sapply(add.day, function(y) sum(sub.day >= y & sub.day <= y+8) > 0)
  keep.sub <- sapply(sub.day, function(y) sum(add.day <= y & add.day >= y-8) > 0)
  data.frame(date=c(add.day[keep.add], sub.day[keep.sub]),
             add=c(rep(T, sum(keep.add)), rep(F, sum(keep.sub))))
})
grouped <- do.call(rbind, spl.keep)

# Determine the number of bounties at each date
diffs <- aggregate(add~date, data=grouped, function(x) sum(x) - sum(!x))
final <- data.frame(date=diffs$date + as.Date("2009-01-01"),
                    numBounty=cumsum(diffs$add))
final <- head(final, -10)

# Generate plot 1
library(ggplot2)
ggplot(final, aes(x=date, y=numBounty)) + geom_line() + stat_smooth() + ylim(0, 600) + xlab("Year") + ylab("Number of Open Bounties") + theme_bw()

# Load the number of questions on each day, calculating number of questions in last week
numQ <- read.csv(numq.csv, stringsAsFactors=F)
names(numQ) <- c("Date", "NumQ")
numQ$Date <- as.Date(numQ$Date)
numQ <- numQ$NumQ[match(final$date, numQ$Date)]
l7Q <- head(numQ, -7) + head(tail(numQ, -1), -6) + head(tail(numQ, -2), -5) + head(tail(numQ, -3), -4) + head(tail(numQ, -4), -3) + head(tail(numQ, -5), -2) + head(tail(numQ, -6), -1) + tail(numQ, -7)
final <- tail(final, -7)
final$l7Q <- l7Q
final$propBounty <- final$numBounty / final$l7Q

# Generate plot 2
ggplot(final, aes(x=date, y=propBounty)) + geom_line() + stat_smooth() + theme_bw() + ylim(0, 0.015) + xlab("Year") + ylab("Number of Open Bounties / Num Questions in Last Week")

# Generate plot 3
dat.play <- dat2
dat.play$Assigned <- as.numeric(!is.na(dat.play$ParentId))
dat.play$CreationDate <- as.Date(dat.play$CreationDate)
ggplot(dat.play, aes(x=CreationDate, y=Assigned)) + stat_smooth() + theme_bw() + ylim(0, 1) + xlab("Year") + ylab("Proportion of Bounties Awarded")


