replaced http://meta.stackexchange.com/ with https://meta.stackexchange.com/
Source Link

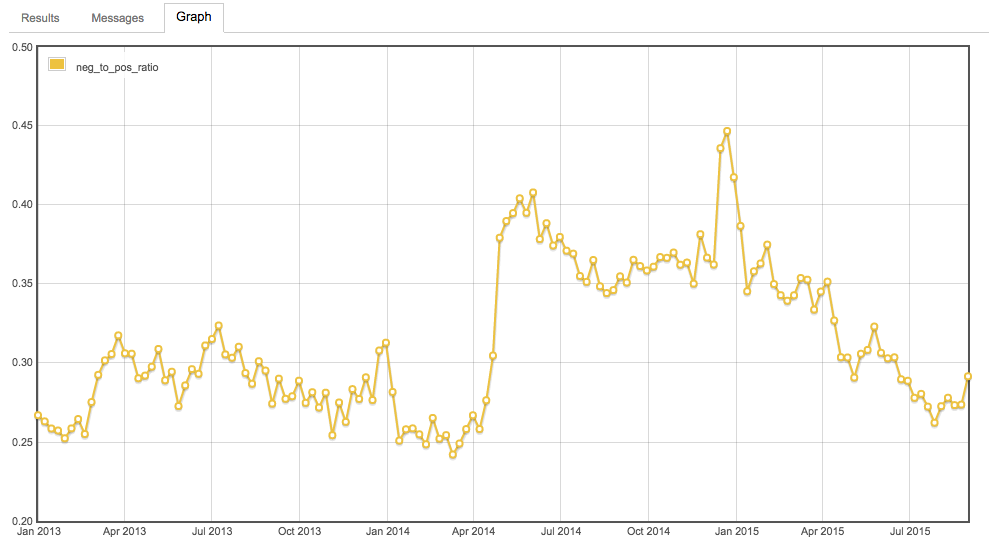
As others have observed, the graph is skewed by the absence of deleted posts, since older downvoted posts are typically deleted. Here's what the graph looks like when deleted posts are included:

enter image description here

Two things to note:

  1. The jump in the last month is gone. This isn't surprising. Recent downvoted, closed posts are often deleted, both automaticallyautomatically and by the community, so more downvoted posts are visible in the last few weeks than in the more distant past.
  2. The jump in April 2014 is still there. Whatever caused this jump, it was not an artifact in question-deletion.

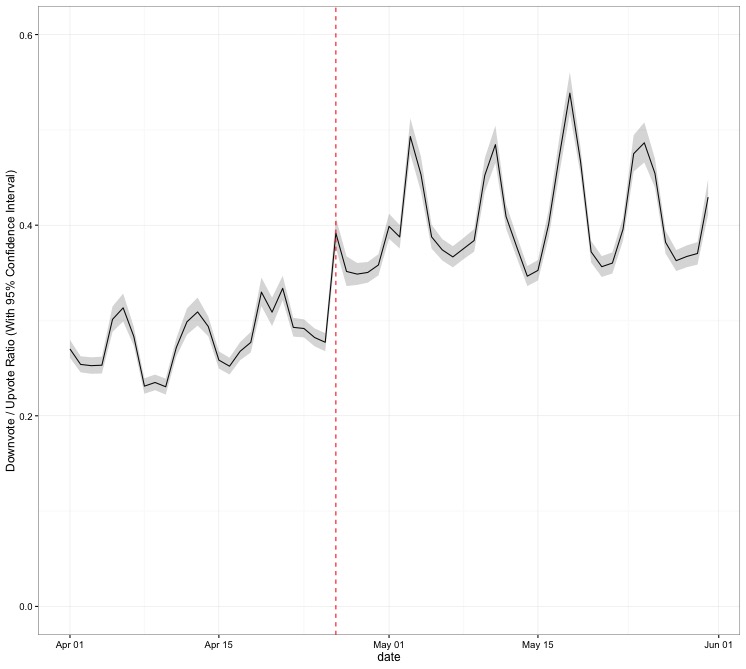
If we zoom in a bit on April-May 2014, we can see where the jump occurred.

enter image description here

If we had to pick a day where the jump occurred, it would be Saturday, April 26, 2014, shown in red. (Fun fact: the downvote/upvote ratio spikes on weekends. This occurs in other months as well).

I've done a little preliminary work to eliminate hypotheses:

  • This isn't statistical chance. The pattern occurs across many days, to an extent far more consistent than random noise. (The confidence ribbons shown above are from a binomial proportion confidence interval).
  • This isn't a few "bad apples." The voting is not being driven by a small number of people (nor could it, really, due to per-person, per-day voting limits). Note that each of these days include at least thousands of downvotes.

Based on this, and on a few brief discussions with others at the company, I'd advance a tentative hypothesis that this is related to the Meta Stack Overflow/Meta Stack Exchange split, which occurred on April 17. This split led to increased attention to Meta, including highly-discussed questions such as Why is Stack Overflow so negative of late? (April 23), as well as concerns about problems with quality (this question was April 28, but there were other discussions around the same time). It's possible that this kind of introspection led people to downvote more as part of their normal activity. While the timing is very suggestive, I don't have solid evidence of this yet. I'm open to your ideas for further analyses!

Finally, I'd note that if you look at the first graph above, the downvote/upvote ratio is dropping again- indeed, it's now right around the levels it was before April 2014. (This effect was mostly masked in the OP by the effect of deleted posts). Some preliminary analyses indicate that that while the April 2014 jump was due to an increase in downvotes, this recent change is from an increase in upvotes.
As others have observed, the graph is skewed by the absence of deleted posts, since older downvoted posts are typically deleted. Here's what the graph looks like when deleted posts are included:

enter image description here

Two things to note:

  1. The jump in the last month is gone. This isn't surprising. Recent downvoted, closed posts are often deleted, both automatically and by the community, so more downvoted posts are visible in the last few weeks than in the more distant past.
  2. The jump in April 2014 is still there. Whatever caused this jump, it was not an artifact in question-deletion.

If we zoom in a bit on April-May 2014, we can see where the jump occurred.

enter image description here

If we had to pick a day where the jump occurred, it would be Saturday, April 26, 2014, shown in red. (Fun fact: the downvote/upvote ratio spikes on weekends. This occurs in other months as well).

I've done a little preliminary work to eliminate hypotheses:

  • This isn't statistical chance. The pattern occurs across many days, to an extent far more consistent than random noise. (The confidence ribbons shown above are from a binomial proportion confidence interval).
  • This isn't a few "bad apples." The voting is not being driven by a small number of people (nor could it, really, due to per-person, per-day voting limits). Note that each of these days include at least thousands of downvotes.

Based on this, and on a few brief discussions with others at the company, I'd advance a tentative hypothesis that this is related to the Meta Stack Overflow/Meta Stack Exchange split, which occurred on April 17. This split led to increased attention to Meta, including highly-discussed questions such as Why is Stack Overflow so negative of late? (April 23), as well as concerns about problems with quality (this question was April 28, but there were other discussions around the same time). It's possible that this kind of introspection led people to downvote more as part of their normal activity. While the timing is very suggestive, I don't have solid evidence of this yet. I'm open to your ideas for further analyses!

Finally, I'd note that if you look at the first graph above, the downvote/upvote ratio is dropping again- indeed, it's now right around the levels it was before April 2014. (This effect was mostly masked in the OP by the effect of deleted posts). Some preliminary analyses indicate that that while the April 2014 jump was due to an increase in downvotes, this recent change is from an increase in upvotes.

replaced http://meta.stackoverflow.com/ with https://meta.stackoverflow.com/
Source Link

As others have observed, the graph is skewed by the absence of deleted posts, since older downvoted posts are typically deleted. Here's what the graph looks like when deleted posts are included:

enter image description here

Two things to note:

  1. The jump in the last month is gone. This isn't surprising. Recent downvoted, closed posts are often deleted, both automatically and by the community, so more downvoted posts are visible in the last few weeks than in the more distant past.
  2. The jump in April 2014 is still there. Whatever caused this jump, it was not an artifact in question-deletion.

If we zoom in a bit on April-May 2014, we can see where the jump occurred.

enter image description here

If we had to pick a day where the jump occurred, it would be Saturday, April 26, 2014, shown in red. (Fun fact: the downvote/upvote ratio spikes on weekends. This occurs in other months as well).

I've done a little preliminary work to eliminate hypotheses:

  • This isn't statistical chance. The pattern occurs across many days, to an extent far more consistent than random noise. (The confidence ribbons shown above are from a binomial proportion confidence interval).
  • This isn't a few "bad apples." The voting is not being driven by a small number of people (nor could it, really, due to per-person, per-day voting limits). Note that each of these days include at least thousands of downvotes.

Based on this, and on a few brief discussions with others at the company, I'd advance a tentative hypothesis that this is related to the Meta Stack Overflow/Meta Stack Exchange split, which occurred on April 17. This split led to increased attention to Meta, including highly-discussed questions such as Why is Stack Overflow so negative of late?Why is Stack Overflow so negative of late? (April 23), as well as concerns about problems with quality (this question was April 28this question was April 28, but there were other discussions around the same time). It's possible that this kind of introspection led people to downvote more as part of their normal activity. While the timing is very suggestive, I don't have solid evidence of this yet. I'm open to your ideas for further analyses!

Finally, I'd note that if you look at the first graph above, the downvote/upvote ratio is dropping again- indeed, it's now right around the levels it was before April 2014. (This effect was mostly masked in the OP by the effect of deleted posts). Some preliminary analyses indicate that that while the April 2014 jump was due to an increase in downvotes, this recent change is from an increase in upvotes.

As others have observed, the graph is skewed by the absence of deleted posts, since older downvoted posts are typically deleted. Here's what the graph looks like when deleted posts are included:

enter image description here

Two things to note:

  1. The jump in the last month is gone. This isn't surprising. Recent downvoted, closed posts are often deleted, both automatically and by the community, so more downvoted posts are visible in the last few weeks than in the more distant past.
  2. The jump in April 2014 is still there. Whatever caused this jump, it was not an artifact in question-deletion.

If we zoom in a bit on April-May 2014, we can see where the jump occurred.

enter image description here

If we had to pick a day where the jump occurred, it would be Saturday, April 26, 2014, shown in red. (Fun fact: the downvote/upvote ratio spikes on weekends. This occurs in other months as well).

I've done a little preliminary work to eliminate hypotheses:

  • This isn't statistical chance. The pattern occurs across many days, to an extent far more consistent than random noise. (The confidence ribbons shown above are from a binomial proportion confidence interval).
  • This isn't a few "bad apples." The voting is not being driven by a small number of people (nor could it, really, due to per-person, per-day voting limits). Note that each of these days include at least thousands of downvotes.

Based on this, and on a few brief discussions with others at the company, I'd advance a tentative hypothesis that this is related to the Meta Stack Overflow/Meta Stack Exchange split, which occurred on April 17. This split led to increased attention to Meta, including highly-discussed questions such as Why is Stack Overflow so negative of late? (April 23), as well as concerns about problems with quality (this question was April 28, but there were other discussions around the same time). It's possible that this kind of introspection led people to downvote more as part of their normal activity. While the timing is very suggestive, I don't have solid evidence of this yet. I'm open to your ideas for further analyses!

Finally, I'd note that if you look at the first graph above, the downvote/upvote ratio is dropping again- indeed, it's now right around the levels it was before April 2014. (This effect was mostly masked in the OP by the effect of deleted posts). Some preliminary analyses indicate that that while the April 2014 jump was due to an increase in downvotes, this recent change is from an increase in upvotes.

deleted 100 characters in body
Source Link

As others have observed, the graph is skewed by the absence of deleted posts, since older downvoted posts are typically deleted. Here's what the graph looks like when deleted posts are included:

enter image description here

Two things to note:

  1. The jump in the last month is gone. This isn't surprising. Recent downvoted, closed posts are often deleted, both automatically and by the community, so more downvoted posts are visible in the last few weeks than in the more distant past.
  2. The jump in April 2014 is still there. Whatever caused this jump, it was not an artifact in question-deletion.

If we zoom in a bit on April-May 2014, we can see where the jump occurred.

enter image description here

(I put the y-axis on a scale from zero, in order to give a sense of the relative size of the jump). If we had to pick a day where the jump occurred, it would be Saturday, April 26, 2014, shown in red. (Fun fact: the downvote/upvote ratio spikes on weekends. This occurs in other months as well).

I've done a little preliminary work to eliminate hypotheses:

  • This isn't statistical chance. The pattern occurs across many days, to an extent far more consistent than random noise. (The confidence ribbons shown above are from a binomial proportion confidence interval).
  • This isn't a few "bad apples." The voting is not being driven by a small number of people (nor could it, really, due to per-person, per-day voting limits). Note that each of these days include at least thousands of downvotes.

Based on this, and on a few brief discussions with others at the company, I'd advance a tentative hypothesis that this is related to the Meta Stack Overflow/Meta Stack Exchange split, which occurred on April 17. This split led to increased attention to Meta, including highly-discussed questions such as Why is Stack Overflow so negative of late? (April 23), as well as concerns about problems with quality (this question was April 28, but there were other discussions around the same time). It's possible that this kind of introspection led people to downvote more as part of their normal activity. While the timing is very suggestive, I don't have solid evidence of this yet. I'm open to your ideas for further analyses!

Finally, I'd note that if you look at the first graph above, the downvote/upvote ratio is dropping again- indeed, it's now right around the levels it was before April 2014. (This effect was mostly masked in the OP by the effect of deleted posts). Some preliminary analyses indicate that that while the April 2014 jump was due to an increase in downvotes, this recent change is from an increase in upvotes.

As others have observed, the graph is skewed by the absence of deleted posts, since older downvoted posts are typically deleted. Here's what the graph looks like when deleted posts are included:

enter image description here

Two things to note:

  1. The jump in the last month is gone. This isn't surprising. Recent downvoted, closed posts are often deleted, both automatically and by the community, so more downvoted posts are visible in the last few weeks than in the more distant past.
  2. The jump in April 2014 is still there. Whatever caused this jump, it was not an artifact in question-deletion.

If we zoom in a bit on April-May 2014, we can see where the jump occurred.

enter image description here

If we had to pick a day where the jump occurred, it would be Saturday, April 26, 2014, shown in red. (Fun fact: the downvote/upvote ratio spikes on weekends. This occurs in other months as well).

I've done a little preliminary work to eliminate hypotheses:

  • This isn't statistical chance. The pattern occurs across many days, to an extent far more consistent than random noise. (The confidence ribbons shown above are from a binomial proportion confidence interval).
  • This isn't a few "bad apples." The voting is not being driven by a small number of people (nor could it, really, due to per-person, per-day voting limits). Note that each of these days include at least thousands of downvotes.

Based on this, and on a few brief discussions with others at the company, I'd advance a tentative hypothesis that this is related to the Meta Stack Overflow/Meta Stack Exchange split, which occurred on April 17. This split led to increased attention to Meta, including highly-discussed questions such as Why is Stack Overflow so negative of late? (April 23), as well as concerns about problems with quality (this question was April 28, but there were other discussions around the same time). It's possible that this kind of introspection led people to downvote more as part of their normal activity. While the timing is very suggestive, I don't have solid evidence of this yet. I'm open to your ideas for further analyses!

Finally, I'd note that if you look at the first graph above, the downvote/upvote ratio is dropping again- indeed, it's now right around the levels it was before April 2014. (This effect was mostly masked in the OP by the effect of deleted posts). Some preliminary analyses indicate that that while the April 2014 jump was due to an increase in downvotes, this recent change is from an increase in upvotes.

Source Link
Loading