replaced http://data.stackexchange.com/ with https://data.stackexchange.com/
Source Link

The data with deleted posts excludeddata with deleted posts excluded looks a lot worse for closed questions. Even when including deleted posts, answers to open questions don't look much better than those to questions closed within a month. If you are looking for the crap predicted by Sturgeon's revelation, don't look at closed questions alone. Closing requires attention from an uncommon set of users. Crap is mostly found in questions that don't get any votes at all:

Question score distributionQuestion score distribution

Josh Caswell suggested looking at anonymous feedback. It turns out that anyone can analyze this on SEDESEDE by querying the PostFeedback table. Intially, I didn't think it would make any sort of difference, but here are answer averages using anonymous voting scoresanswer averages using anonymous voting scores:

Now the contrast between early and late closes is stark. Anonymous feedback is very sparse and strongly correlated to viewsstrongly correlated to views. Questions closed within a month of asking are just not viewed very often. Questions closed after a month are some of our most-viewed questions. To judge by anonymous feedback, they have some of our most useful answers as well. There aren't many sites that would allow popular pages like these to be put on a path to deletion.
The data with deleted posts excluded looks a lot worse for closed questions. Even when including deleted posts, answers to open questions don't look much better than those to questions closed within a month. If you are looking for the crap predicted by Sturgeon's revelation, don't look at closed questions alone. Closing requires attention from an uncommon set of users. Crap is mostly found in questions that don't get any votes at all:

Question score distribution

Josh Caswell suggested looking at anonymous feedback. It turns out that anyone can analyze this on SEDE by querying the PostFeedback table. Intially, I didn't think it would make any sort of difference, but here are answer averages using anonymous voting scores:

Now the contrast between early and late closes is stark. Anonymous feedback is very sparse and strongly correlated to views. Questions closed within a month of asking are just not viewed very often. Questions closed after a month are some of our most-viewed questions. To judge by anonymous feedback, they have some of our most useful answers as well. There aren't many sites that would allow popular pages like these to be put on a path to deletion.

replaced http://blog.stackoverflow.com with https://blog.stackoverflow.com
Source Link
  1. Questions that are so poorly written we can't expect the answers to be meaningful to anyone (least of all the original asker).
  2. Questions that ask the same thing that's been asked dozens of times beforeasked dozens of times before.
  3. Questions that start off interesting and fun, but eventually get boring.

For the most part, knowledgeable people can come to some sort of agreement about #1 and #2. But #3 is where reasonable people can and do disagree. If you go back and listen to the early podcasts, you can tell that Jeff and Joel were on nearly opposite ends of the spectrum. (In fact, hearing them disagree politely was one of the attractions of listening for me.) But even in Stack Overflow: Where We Hate FunStack Overflow: Where We Hate Fun you can see a concession to finding a proper balance between serious and not-so-serious questions:

Truthfully, it's been a long time since Stack Overflow has tolerated even a limited amount of fun questions. Instead, we've facilitated fun on meta (to a degree), chat, and with events like Winter BashWinter Bash. When people say that closing works, I suspect that's what they are thinking about. I'm a little sad that the community landed in this place, but it hasn't seemed to hurt the site. Counterintuitively, banning fun has probably contributed to Stack Overflow's growth.

  1. Questions that are so poorly written we can't expect the answers to be meaningful to anyone (least of all the original asker).
  2. Questions that ask the same thing that's been asked dozens of times before.
  3. Questions that start off interesting and fun, but eventually get boring.

For the most part, knowledgeable people can come to some sort of agreement about #1 and #2. But #3 is where reasonable people can and do disagree. If you go back and listen to the early podcasts, you can tell that Jeff and Joel were on nearly opposite ends of the spectrum. (In fact, hearing them disagree politely was one of the attractions of listening for me.) But even in Stack Overflow: Where We Hate Fun you can see a concession to finding a proper balance between serious and not-so-serious questions:

Truthfully, it's been a long time since Stack Overflow has tolerated even a limited amount of fun questions. Instead, we've facilitated fun on meta (to a degree), chat, and with events like Winter Bash. When people say that closing works, I suspect that's what they are thinking about. I'm a little sad that the community landed in this place, but it hasn't seemed to hurt the site. Counterintuitively, banning fun has probably contributed to Stack Overflow's growth.

replaced http://meta.stackexchange.com/ with https://meta.stackexchange.com/
Source Link

The data with deleted posts excluded looks a lot worse for closed questions. Even when including deleted posts, answers to open questions don't look much better than those to questions closed within a month. If you are looking for the crap predicted by Sturgeon's revelation, don't look at closed questionsclosed questions alone. Closing requires attention from an uncommon set of users. Crap is mostly found in questions that don't get any votes at all:

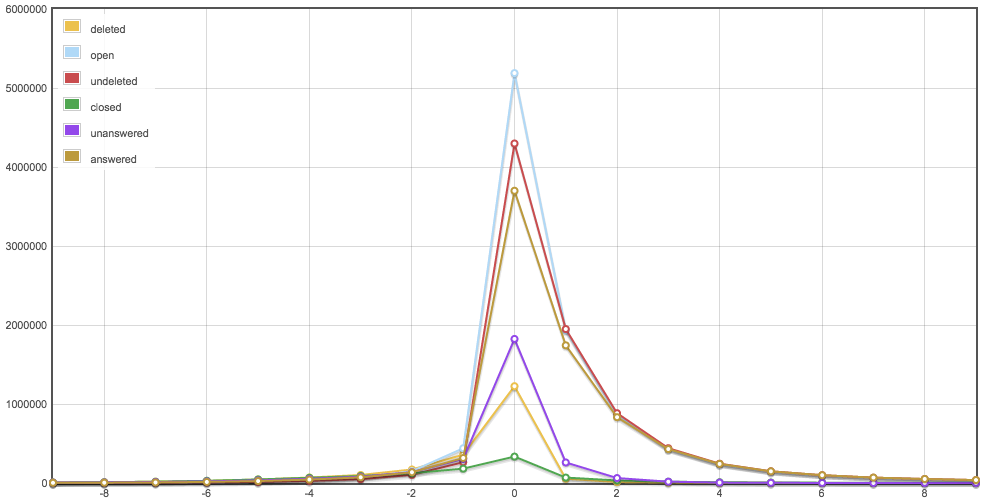
This x-axis is question score from -9 to +9 and the y-axis is the count of questions with each score in the various states. The image includes deleted questions, but the linked query does not. What the graph doesn't show is the untold number of questions that are never asked because of rolling rate limitsrolling rate limits and other quality measures that happen behind the scenes. I'm showing this graph to demonstrate that first line of defense against low-quality questions is ignoring them.

The data with deleted posts excluded looks a lot worse for closed questions. Even when including deleted posts, answers to open questions don't look much better than those to questions closed within a month. If you are looking for the crap predicted by Sturgeon's revelation, don't look at closed questions alone. Closing requires attention from an uncommon set of users. Crap is mostly found in questions that don't get any votes at all:

This x-axis is question score from -9 to +9 and the y-axis is the count of questions with each score in the various states. The image includes deleted questions, but the linked query does not. What the graph doesn't show is the untold number of questions that are never asked because of rolling rate limits and other quality measures that happen behind the scenes. I'm showing this graph to demonstrate that first line of defense against low-quality questions is ignoring them.

replaced http://meta.stackoverflow.com/ with https://meta.stackoverflow.com/
Source Link
Loading
typo corrected
Source Link
gnat
  • 6.2k
  • 10
  • 109
  • 177
Loading
Source Link
Jon Ericson Staff
  • 21.5k
  • 27
  • 153
  • 182
Loading