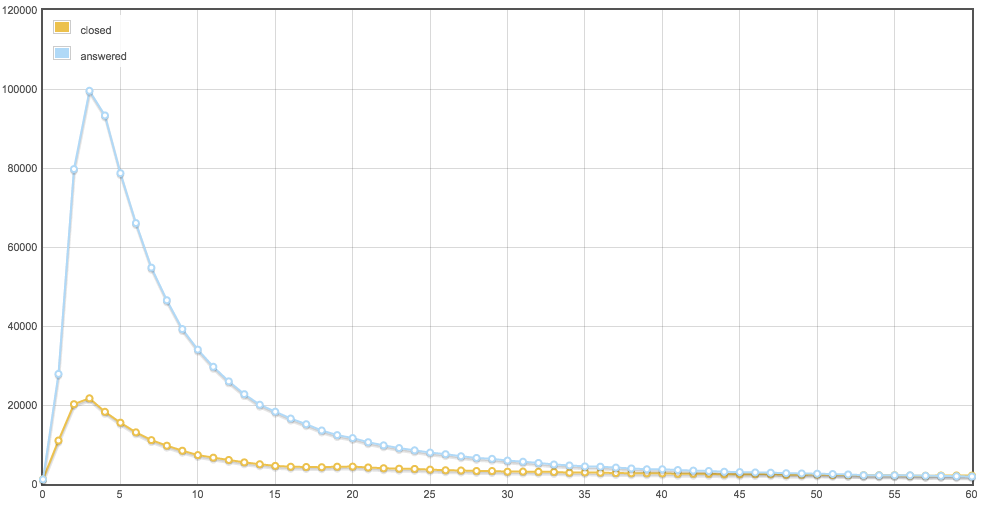
This graph looks only at questions that are currently closed and shows how long (in minutes) it took for them to be answered and closed. The x-axis is the time elapsed in minutes and the y-axis is number of events. There are more total answers than closures because I'm only counting the time of the most recent closure, but including all answers. (I've linked to a SEDE querySEDE query so that you can see what I'm up to. But notice that the public data does not include deleted posts.)
Of interest, here is the same query excluding deleted postssame query excluding deleted posts:
